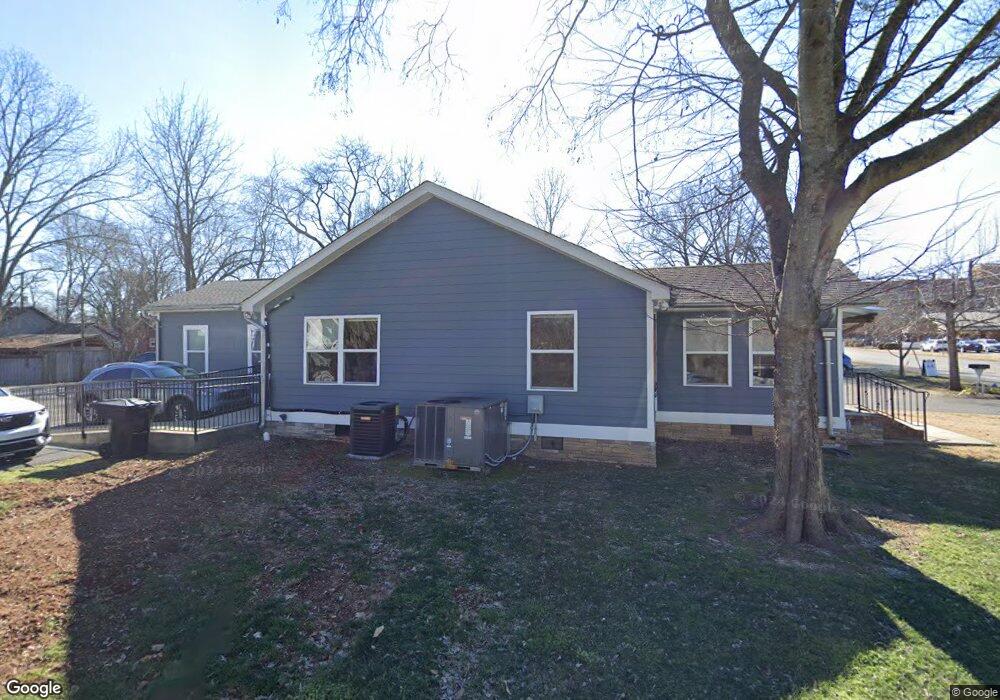
632 N Walnut St Murfreesboro, TN 37130
Estimated Value: $291,968
Studio
1
Bath
840
Sq Ft
$348/Sq Ft
Est. Value
About This Home
This home is located at 632 N Walnut St, Murfreesboro, TN 37130 and is currently estimated at $291,968, approximately $347 per square foot. 632 N Walnut St is a home located in Rutherford County with nearby schools including Mitchell-Neilson Elementary, Siegel Middle School, and Siegel High School.
Ownership History
Date
Name
Owned For
Owner Type
Purchase Details
Closed on
May 13, 2016
Sold by
Reese Darrell B
Bought by
Hedding Katja
Current Estimated Value
Purchase Details
Closed on
Feb 19, 2003
Sold by
Lynn Harris Ronald
Bought by
Rucci Harris Cindy L
Purchase Details
Closed on
Sep 21, 1999
Sold by
Cindy Harris
Bought by
Brown Gregory W and Brown Renee M
Home Financials for this Owner
Home Financials are based on the most recent Mortgage that was taken out on this home.
Original Mortgage
$31,900
Interest Rate
7.89%
Mortgage Type
Commercial
Purchase Details
Closed on
Aug 24, 1999
Sold by
Reese Darrell B and Reese Lyvonn
Bought by
Cindy Harris
Home Financials for this Owner
Home Financials are based on the most recent Mortgage that was taken out on this home.
Original Mortgage
$31,900
Interest Rate
7.89%
Mortgage Type
Commercial
Purchase Details
Closed on
Feb 23, 1999
Sold by
Dewayne Seay Phillip
Bought by
Reese Darrell B and Reese Lyvonn
Create a Home Valuation Report for This Property
The Home Valuation Report is an in-depth analysis detailing your home's value as well as a comparison with similar homes in the area
Home Values in the Area
Average Home Value in this Area
Purchase History
| Date | Buyer | Sale Price | Title Company |
|---|---|---|---|
| Hedding Katja | $134,000 | -- | |
| Rucci Harris Cindy L | -- | -- | |
| Brown Gregory W | $37,500 | -- | |
| Cindy Harris | $85,000 | -- | |
| Reese Darrell B | $83,750 | -- |
Source: Public Records
Mortgage History
| Date | Status | Borrower | Loan Amount |
|---|---|---|---|
| Previous Owner | Reese Darrell B | $31,900 | |
| Previous Owner | Reese Darrell B | $76,500 |
Source: Public Records
Tax History
| Year | Tax Paid | Tax Assessment Tax Assessment Total Assessment is a certain percentage of the fair market value that is determined by local assessors to be the total taxable value of land and additions on the property. | Land | Improvement |
|---|---|---|---|---|
| 2025 | $2,741 | $96,920 | $33,920 | $63,000 |
| 2024 | $0 | $96,920 | $33,920 | $63,000 |
| 2023 | $1,818 | $96,920 | $33,920 | $63,000 |
| 2022 | $1,566 | $96,920 | $33,920 | $63,000 |
| 2021 | $1,348 | $60,720 | $25,720 | $35,000 |
| 2020 | $1,348 | $60,720 | $25,720 | $35,000 |
| 2019 | $1,348 | $60,720 | $25,720 | $35,000 |
| 2018 | $1,851 | $60,720 | $0 | $0 |
| 2017 | $2,243 | $57,720 | $0 | $0 |
| 2016 | $1,309 | $33,680 | $0 | $0 |
| 2015 | $1,309 | $33,680 | $0 | $0 |
| 2014 | $838 | $33,680 | $0 | $0 |
| 2013 | -- | $35,080 | $0 | $0 |
Source: Public Records
Map
Nearby Homes
- 718 N Walnut St
- 807 N Maple St
- 520 N Maple St Unit 3
- 520 N Maple St Unit 2
- 520 N Maple St Unit 1
- 513 N Maple St
- 412 N Church St
- 515 N Academy St Unit 517
- 422 N Academy St
- 1009 N Church St Unit 17
- 1022 Poplar Ave
- 1019 N Maple St Unit 2B
- 520 W College St
- 225 N Academy St
- 534 N Maney Ave
- 418 Lynn St
- 1212 N Spring St
- 445 Jackson St
- 608 Lynn St
- 725 N Highland Ave
- 624 N Walnut St
- 703 N Maple St
- 627 N Maple St
- 619 N Maple St
- 707 N Maple St
- 620 N Walnut St
- 619 N Walnut St
- 707 N Walnut St
- 711 N Maple St
- 711 N Maple St Unit B
- 611 N Maple St
- 608 N Walnut St
- 717 N Maple St
- 605 N Maple St
- 305 Ridgely Rd Unit 307
- 305 Ridgely Rd Unit 305
- 700 N Maple St
- 624 N Maple St
- 704 N Maple St
- 721 N Maple St
Your Personal Tour Guide
Ask me questions while you tour the home.