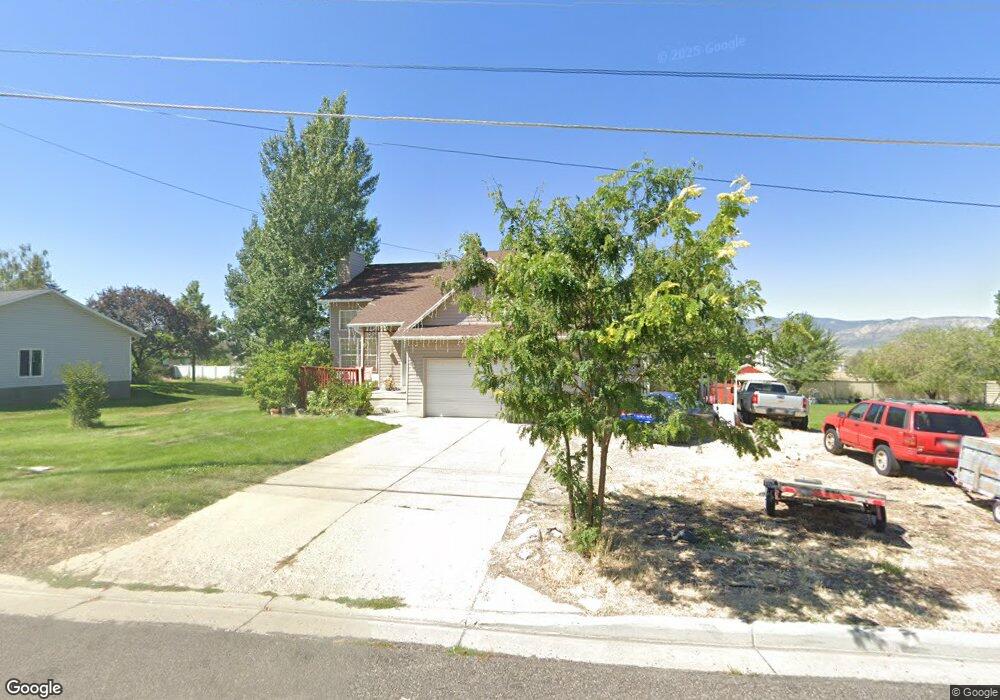
632 S 100 E Ephraim, UT 84627
Estimated Value: $373,000 - $416,000
3
Beds
3
Baths
2,100
Sq Ft
$189/Sq Ft
Est. Value
About This Home
This home is located at 632 S 100 E, Ephraim, UT 84627 and is currently estimated at $396,049, approximately $188 per square foot. 632 S 100 E is a home located in Sanpete County.
Ownership History
Date
Name
Owned For
Owner Type
Purchase Details
Closed on
Apr 16, 2021
Sold by
Nunley Larry R
Bought by
Barker Samuel
Current Estimated Value
Home Financials for this Owner
Home Financials are based on the most recent Mortgage that was taken out on this home.
Original Mortgage
$460,500
Outstanding Balance
$413,063
Interest Rate
3%
Mortgage Type
Construction
Estimated Equity
-$17,014
Purchase Details
Closed on
Mar 17, 2006
Sold by
Christison Paul K
Bought by
Nunley Larry R and Nunley Lenis
Create a Home Valuation Report for This Property
The Home Valuation Report is an in-depth analysis detailing your home's value as well as a comparison with similar homes in the area
Home Values in the Area
Average Home Value in this Area
Purchase History
| Date | Buyer | Sale Price | Title Company |
|---|---|---|---|
| Barker Samuel | $575,625 | Utah First Title Ins Age | |
| Nunley Larry R | -- | -- |
Source: Public Records
Mortgage History
| Date | Status | Borrower | Loan Amount |
|---|---|---|---|
| Open | Barker Samuel | $460,500 |
Source: Public Records
Tax History
| Year | Tax Paid | Tax Assessment Tax Assessment Total Assessment is a certain percentage of the fair market value that is determined by local assessors to be the total taxable value of land and additions on the property. | Land | Improvement |
|---|---|---|---|---|
| 2025 | $1,947 | $188,615 | $0 | $0 |
| 2024 | $1,928 | $177,501 | $0 | $0 |
| 2023 | $1,902 | $166,668 | $0 | $0 |
| 2022 | $1,958 | $156,375 | $0 | $0 |
| 2021 | $1,904 | $131,395 | $0 | $0 |
| 2020 | $1,773 | $115,179 | $0 | $0 |
| 2019 | $1,675 | $107,089 | $0 | $0 |
| 2018 | $1,512 | $169,309 | $31,977 | $137,332 |
| 2017 | $1,281 | $82,590 | $0 | $0 |
| 2016 | $1,208 | $77,896 | $0 | $0 |
| 2015 | $1,214 | $77,896 | $0 | $0 |
| 2014 | $1,194 | $77,896 | $0 | $0 |
| 2013 | $1,188 | $77,896 | $0 | $0 |
Source: Public Records
Map
Nearby Homes
Your Personal Tour Guide
Ask me questions while you tour the home.