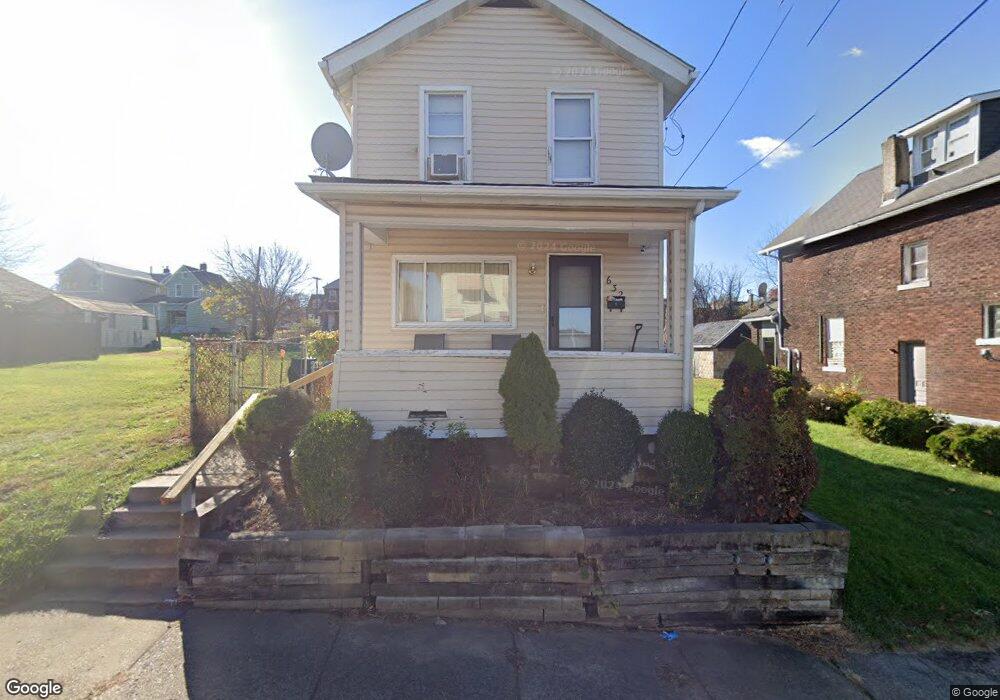
632 S 5th St Duquesne, PA 15110
Estimated Value: $41,000 - $59,000
2
Beds
1
Bath
1,054
Sq Ft
$48/Sq Ft
Est. Value
About This Home
This home is located at 632 S 5th St, Duquesne, PA 15110 and is currently estimated at $50,730, approximately $48 per square foot. 632 S 5th St is a home located in Allegheny County with nearby schools including Duquesne Elementary School, Propel Schools - McKeesport, and St Agnes School.
Ownership History
Date
Name
Owned For
Owner Type
Purchase Details
Closed on
May 16, 2016
Sold by
Coward Robert
Bought by
Porfilio Real Estate L L C
Current Estimated Value
Purchase Details
Closed on
Feb 3, 2012
Sold by
Benedict Scott
Bought by
Hu Ying
Purchase Details
Closed on
Jun 7, 2002
Sold by
Frizzi Melissa A
Bought by
Hud
Purchase Details
Closed on
Jan 9, 2002
Sold by
Hud
Bought by
Capuzzi Frank J and Capuzzi Donna
Purchase Details
Closed on
Aug 29, 1994
Sold by
Feschuk John
Bought by
Frizzi Melissa A
Create a Home Valuation Report for This Property
The Home Valuation Report is an in-depth analysis detailing your home's value as well as a comparison with similar homes in the area
Home Values in the Area
Average Home Value in this Area
Purchase History
| Date | Buyer | Sale Price | Title Company |
|---|---|---|---|
| Porfilio Real Estate L L C | $10,000 | Settlements Ltd | |
| Hu Ying | $16,500 | -- | |
| Hud | $949 | -- | |
| Capuzzi Frank J | $9,730 | -- | |
| Frizzi Melissa A | $22,000 | -- |
Source: Public Records
Tax History Compared to Growth
Tax History
| Year | Tax Paid | Tax Assessment Tax Assessment Total Assessment is a certain percentage of the fair market value that is determined by local assessors to be the total taxable value of land and additions on the property. | Land | Improvement |
|---|---|---|---|---|
| 2025 | $729 | $16,500 | $3,100 | $13,400 |
| 2024 | $713 | $16,500 | $3,100 | $13,400 |
| 2023 | $721 | $16,500 | $3,100 | $13,400 |
| 2022 | $705 | $16,500 | $3,100 | $13,400 |
| 2021 | $638 | $16,500 | $3,100 | $13,400 |
| 2020 | $705 | $16,500 | $3,100 | $13,400 |
| 2019 | $590 | $16,500 | $3,100 | $13,400 |
| 2018 | $78 | $16,500 | $3,100 | $13,400 |
| 2017 | $590 | $16,500 | $3,100 | $13,400 |
| 2016 | $78 | $16,500 | $3,100 | $13,400 |
| 2015 | $78 | $16,500 | $3,100 | $13,400 |
| 2014 | $367 | $16,500 | $3,100 | $13,400 |
Source: Public Records
Map
Nearby Homes