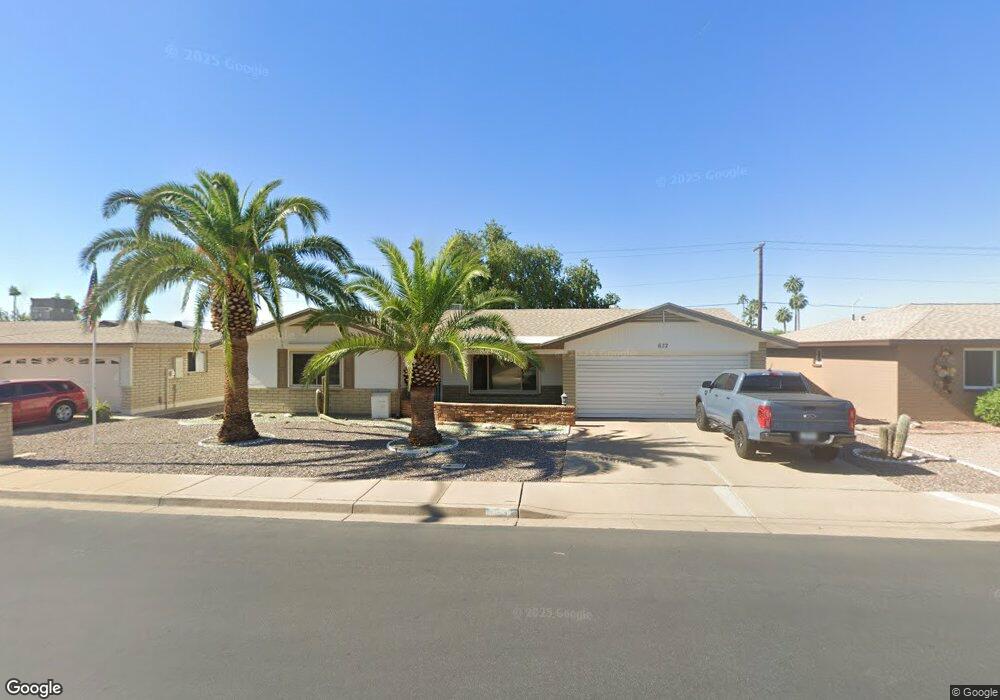
632 S Portland Mesa, AZ 85206
Sunland Village NeighborhoodEstimated Value: $307,152 - $415,000
2
Beds
2
Baths
1,393
Sq Ft
$261/Sq Ft
Est. Value
About This Home
This home is located at 632 S Portland, Mesa, AZ 85206 and is currently estimated at $364,038, approximately $261 per square foot. 632 S Portland is a home located in Maricopa County with nearby schools including Franklin at Brimhall Elementary School, Madison Elementary School, and Franklin West Elementary School.
Ownership History
Date
Name
Owned For
Owner Type
Purchase Details
Closed on
May 23, 2011
Sold by
Huschka Kathryn J
Bought by
Sell Larry R and Sell Susan R
Current Estimated Value
Purchase Details
Closed on
Jul 22, 2003
Sold by
The Estate Of Lyman D Cecil and Cecil Lyman Wynona
Bought by
Cecil Johansen Wynona
Purchase Details
Closed on
Apr 6, 2000
Sold by
Cecil Toni M
Bought by
Cecil Lyman D
Purchase Details
Closed on
Feb 10, 1999
Sold by
Zavertnik Blanche
Bought by
Zavertnik Blanche
Purchase Details
Closed on
Nov 2, 1998
Sold by
Huschka Leroy J and Huschka Kathryn J
Bought by
Huschka Leroy J and Huschka Kathryn J
Purchase Details
Closed on
Oct 3, 1997
Sold by
Green Peter A and Green Elisabeth A
Bought by
Huschka Leroy and Huschka Kathryn
Purchase Details
Closed on
Oct 27, 1994
Sold by
Vangorder Ray A and Vangorder Mary H
Bought by
Vangorder Ray A and Vangorder Mary H
Create a Home Valuation Report for This Property
The Home Valuation Report is an in-depth analysis detailing your home's value as well as a comparison with similar homes in the area
Home Values in the Area
Average Home Value in this Area
Purchase History
| Date | Buyer | Sale Price | Title Company |
|---|---|---|---|
| Sell Larry R | $138,900 | Title Management Agency Of A | |
| Cecil Johansen Wynona | -- | -- | |
| Cecil Lyman D | -- | Equity Title Agency | |
| Zavertnik Blanche | -- | -- | |
| Zavertnik Blanche | -- | -- | |
| Huschka Leroy J | -- | -- | |
| Huschka Leroy | $95,000 | Transnation Title Ins Co | |
| Vangorder Ray A | -- | -- |
Source: Public Records
Tax History Compared to Growth
Tax History
| Year | Tax Paid | Tax Assessment Tax Assessment Total Assessment is a certain percentage of the fair market value that is determined by local assessors to be the total taxable value of land and additions on the property. | Land | Improvement |
|---|---|---|---|---|
| 2025 | $1,461 | $17,253 | -- | -- |
| 2024 | $1,476 | $16,431 | -- | -- |
| 2023 | $1,476 | $24,630 | $4,920 | $19,710 |
| 2022 | $1,445 | $20,220 | $4,040 | $16,180 |
| 2021 | $1,479 | $16,830 | $3,360 | $13,470 |
| 2020 | $1,458 | $16,620 | $3,320 | $13,300 |
| 2019 | $1,353 | $15,060 | $3,010 | $12,050 |
| 2018 | $1,291 | $14,030 | $2,800 | $11,230 |
| 2017 | $1,251 | $12,100 | $2,420 | $9,680 |
| 2016 | $1,228 | $12,810 | $2,560 | $10,250 |
| 2015 | $1,157 | $11,580 | $2,310 | $9,270 |
Source: Public Records
Map
Nearby Homes
- 4363 E Dragoon Cir
- 4447 E Carmel Ave
- 4501 E Carol Ave Unit 48
- 4502 E Carol Ave Unit 4
- 4502 E Carol Ave Unit 1
- 515 S Parkcrest Unit 541
- 4329 E Capri Ave Unit 219
- 4329 E Capri Ave Unit 212
- 4329 E Capri Ave Unit 217
- 4230 E Carmel Ave
- 520 S Greenfield Rd Unit 39
- 520 S Greenfield Rd Unit 26
- 520 S Greenfield Rd Unit 13
- 520 S Greenfield Rd Unit 24
- 4147 E Dolphin Ave
- 440 S Parkcrest Unit 22
- 440 S Parkcrest Unit 145
- 440 S Parkcrest Unit 88
- 440 S Parkcrest Unit 118
- 453 S Parkcrest Unit 416
- 624 S Portland
- 638 S Portland
- 646 S Portland
- 4422 E Dragoon Ave
- 616 S Portland
- 4421 E Dragoon Ave
- 4423 E Catalina Ave
- 4354 E Dragoon Cir
- 4361 E Catalina Cir
- 652 S Portland
- 4428 E Dragoon Ave
- 610 S Portland
- 651 S Portland
- 4429 E Dragoon Ave
- 4431 E Catalina Ave
- 4348 E Dragoon Cir
- 4338 E Catalina Cir
- 4358 E Catalina Cir
- 4436 E Dragoon Ave
- 660 S Portland