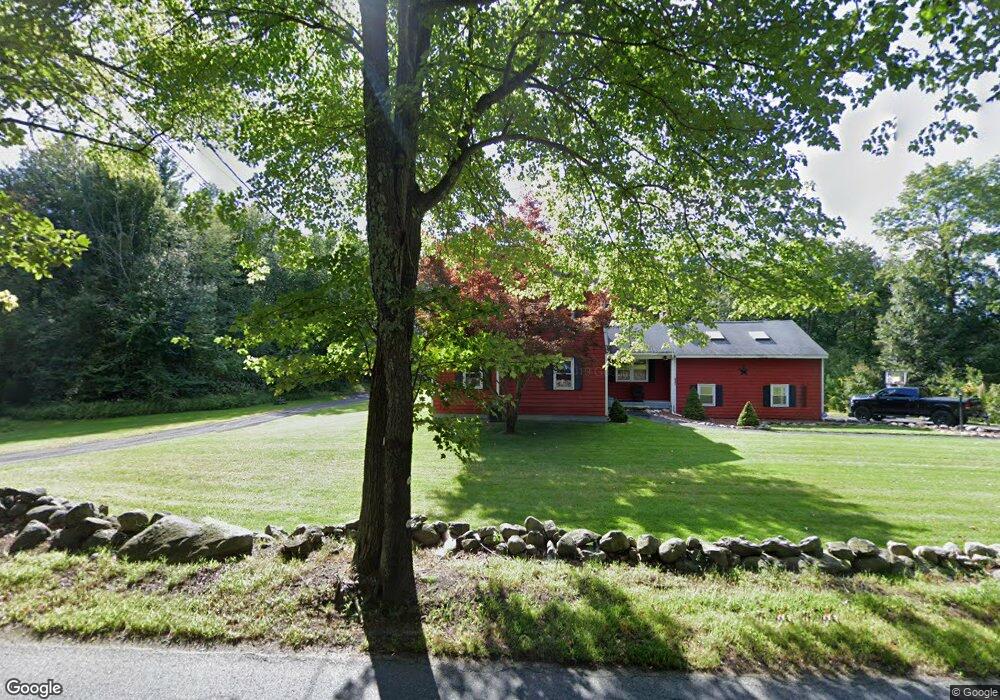
632 Salem Rd Dracut, MA 01826
Estimated Value: $784,000 - $841,000
4
Beds
3
Baths
3,497
Sq Ft
$229/Sq Ft
Est. Value
About This Home
This home is located at 632 Salem Rd, Dracut, MA 01826 and is currently estimated at $802,392, approximately $229 per square foot. 632 Salem Rd is a home with nearby schools including Marsh Grammar School, South Point Elementary School, and Methuen High School.
Ownership History
Date
Name
Owned For
Owner Type
Purchase Details
Closed on
Dec 23, 2009
Sold by
Cieslik Irene and Cieslik James R
Bought by
Cieslik James R and Butler Donna
Current Estimated Value
Purchase Details
Closed on
May 10, 2005
Sold by
Cieslik James R
Bought by
Cieslik James R and Cieslik Jason R
Home Financials for this Owner
Home Financials are based on the most recent Mortgage that was taken out on this home.
Original Mortgage
$304,000
Interest Rate
6.01%
Create a Home Valuation Report for This Property
The Home Valuation Report is an in-depth analysis detailing your home's value as well as a comparison with similar homes in the area
Home Values in the Area
Average Home Value in this Area
Purchase History
| Date | Buyer | Sale Price | Title Company |
|---|---|---|---|
| Cieslik James R | -- | -- | |
| Cieslik James R | -- | -- |
Source: Public Records
Mortgage History
| Date | Status | Borrower | Loan Amount |
|---|---|---|---|
| Previous Owner | Cieslik James R | $304,000 |
Source: Public Records
Tax History Compared to Growth
Tax History
| Year | Tax Paid | Tax Assessment Tax Assessment Total Assessment is a certain percentage of the fair market value that is determined by local assessors to be the total taxable value of land and additions on the property. | Land | Improvement |
|---|---|---|---|---|
| 2025 | $7,191 | $710,600 | $211,600 | $499,000 |
| 2024 | $6,903 | $660,600 | $201,500 | $459,100 |
| 2023 | $6,694 | $578,100 | $175,200 | $402,900 |
| 2022 | $6,616 | $538,300 | $159,200 | $379,100 |
| 2021 | $6,009 | $461,900 | $144,600 | $317,300 |
| 2020 | $5,435 | $407,100 | $140,300 | $266,800 |
| 2019 | $0 | $377,400 | $133,600 | $243,800 |
| 2018 | $1,949 | $367,000 | $133,600 | $233,400 |
| 2017 | $5,140 | $367,000 | $133,600 | $233,400 |
| 2016 | $5,161 | $347,800 | $128,400 | $219,400 |
| 2015 | $4,963 | $332,400 | $128,400 | $204,000 |
| 2014 | $4,628 | $319,400 | $128,400 | $191,000 |
Source: Public Records
Map
Nearby Homes