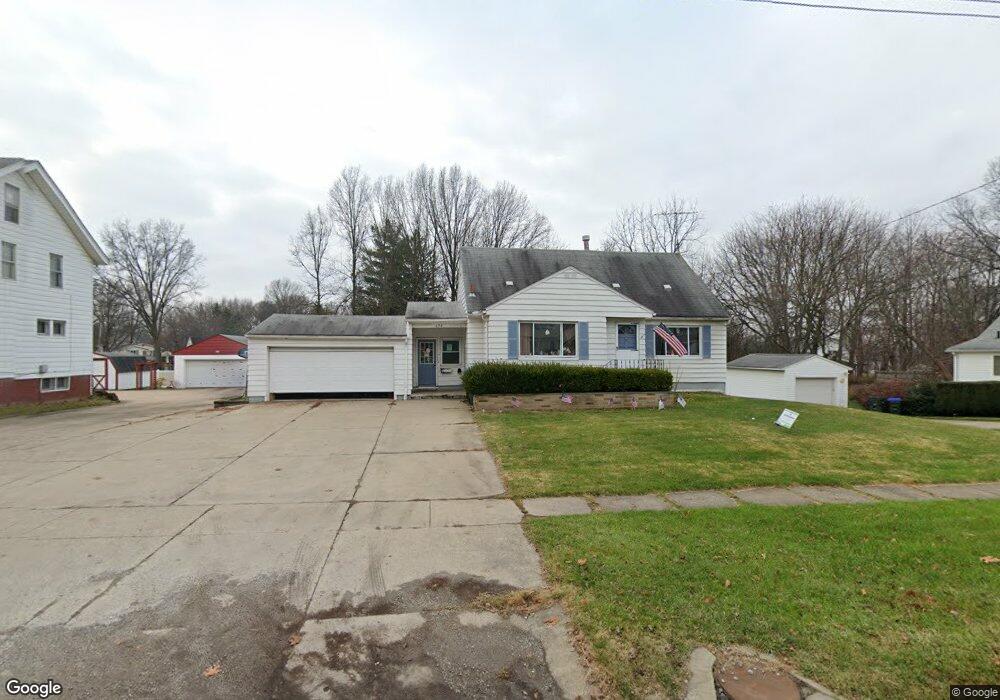
632 Tallmadge Rd Cuyahoga Falls, OH 44221
Southeast Cuyahoga Falls NeighborhoodEstimated Value: $182,000 - $208,199
2
Beds
2
Baths
1,044
Sq Ft
$191/Sq Ft
Est. Value
About This Home
This home is located at 632 Tallmadge Rd, Cuyahoga Falls, OH 44221 and is currently estimated at $199,550, approximately $191 per square foot. 632 Tallmadge Rd is a home located in Summit County with nearby schools including Preston Elementary School, Bolich Middle School, and Cuyahoga Falls High School.
Ownership History
Date
Name
Owned For
Owner Type
Purchase Details
Closed on
Sep 23, 2010
Sold by
Whetsel Carly M and Haver Carly M
Bought by
Whetsel Shawn E and Whetsel Carly M
Current Estimated Value
Purchase Details
Closed on
Apr 29, 2010
Sold by
Whetsel Larry E and Whetsel Patricia K
Bought by
Haver Carly M
Home Financials for this Owner
Home Financials are based on the most recent Mortgage that was taken out on this home.
Original Mortgage
$142,500
Outstanding Balance
$95,372
Interest Rate
5.02%
Mortgage Type
Purchase Money Mortgage
Estimated Equity
$104,178
Purchase Details
Closed on
Nov 12, 2008
Sold by
Whetsel Larry E and Whetsel Patricia K
Bought by
Whetsel Larry E and Whetsel Patricia K
Purchase Details
Closed on
Sep 13, 2006
Sold by
Mongold Larry D
Bought by
Whetsel Larry E and Whetsel Patricia
Purchase Details
Closed on
Dec 9, 2003
Sold by
Derita John M and Derita Kathy Sue
Bought by
Mongold Larry D
Home Financials for this Owner
Home Financials are based on the most recent Mortgage that was taken out on this home.
Original Mortgage
$109,900
Interest Rate
6.08%
Mortgage Type
Purchase Money Mortgage
Create a Home Valuation Report for This Property
The Home Valuation Report is an in-depth analysis detailing your home's value as well as a comparison with similar homes in the area
Home Values in the Area
Average Home Value in this Area
Purchase History
| Date | Buyer | Sale Price | Title Company |
|---|---|---|---|
| Whetsel Shawn E | -- | Attorney | |
| Haver Carly M | $142,500 | Attorney | |
| Whetsel Larry E | -- | None Available | |
| Whetsel Larry E | $146,000 | None Available | |
| Mongold Larry D | $129,400 | Falls Title Agency Inc |
Source: Public Records
Mortgage History
| Date | Status | Borrower | Loan Amount |
|---|---|---|---|
| Open | Haver Carly M | $142,500 | |
| Previous Owner | Mongold Larry D | $109,900 |
Source: Public Records
Tax History Compared to Growth
Tax History
| Year | Tax Paid | Tax Assessment Tax Assessment Total Assessment is a certain percentage of the fair market value that is determined by local assessors to be the total taxable value of land and additions on the property. | Land | Improvement |
|---|---|---|---|---|
| 2025 | $3,222 | $59,623 | $8,222 | $51,401 |
| 2024 | $3,222 | $59,623 | $8,222 | $51,401 |
| 2023 | $3,222 | $59,623 | $8,222 | $51,401 |
| 2022 | $2,767 | $41,577 | $5,632 | $35,945 |
| 2021 | $2,767 | $41,577 | $5,632 | $35,945 |
| 2020 | $2,722 | $41,580 | $5,630 | $35,950 |
| 2019 | $2,852 | $39,660 | $5,630 | $34,030 |
| 2018 | $2,423 | $39,660 | $5,630 | $34,030 |
| 2017 | $2,042 | $39,660 | $5,630 | $34,030 |
| 2016 | $2,044 | $33,860 | $5,630 | $28,230 |
| 2015 | $2,042 | $33,860 | $5,630 | $28,230 |
| 2014 | $2,043 | $33,860 | $5,630 | $28,230 |
| 2013 | $2,041 | $34,110 | $5,630 | $28,480 |
Source: Public Records
Map
Nearby Homes
- 616 Tallmadge Rd
- 562 Tallmadge Rd
- 1944 High St
- 955 Davis Ave
- 1512 Bancroft St
- 2020 Deming St
- 806 Curtis Ave
- 965 Elizabeth Ct
- 425 Myrtle Ave
- 721 Myrtle Ave
- 1846 Front St Unit 402
- 1734 Front St Unit 34
- 1734 Front St Unit 37
- 1734 Front St Unit 36
- 1734 Front St Unit 35
- 1757 3rd St
- 116 Munroe Falls Ave
- 1921 Dwight St
- 1276 Bailey Rd
- 1512 Treasch Dr
- 636 Tallmadge Rd
- 624 Tallmadge Rd
- 607 Sill Ave
- 617 Sill Ave
- 601 Sill Ave
- 620 Tallmadge Rd
- 565 Sill Ave
- 654 Tallmadge Rd
- 612 Tallmadge Rd
- 617 Tallmadge Rd
- 639 Tallmadge Rd
- 647 Tallmadge Rd
- 660 Tallmadge Rd
- 615 Tallmadge Rd
- 613 Tallmadge Rd
- 606 Tallmadge Rd
- 559 Sill Ave
- 1664 Kemppel Cir
- 1901 Searl St Unit 1903
- 610 Sill Ave