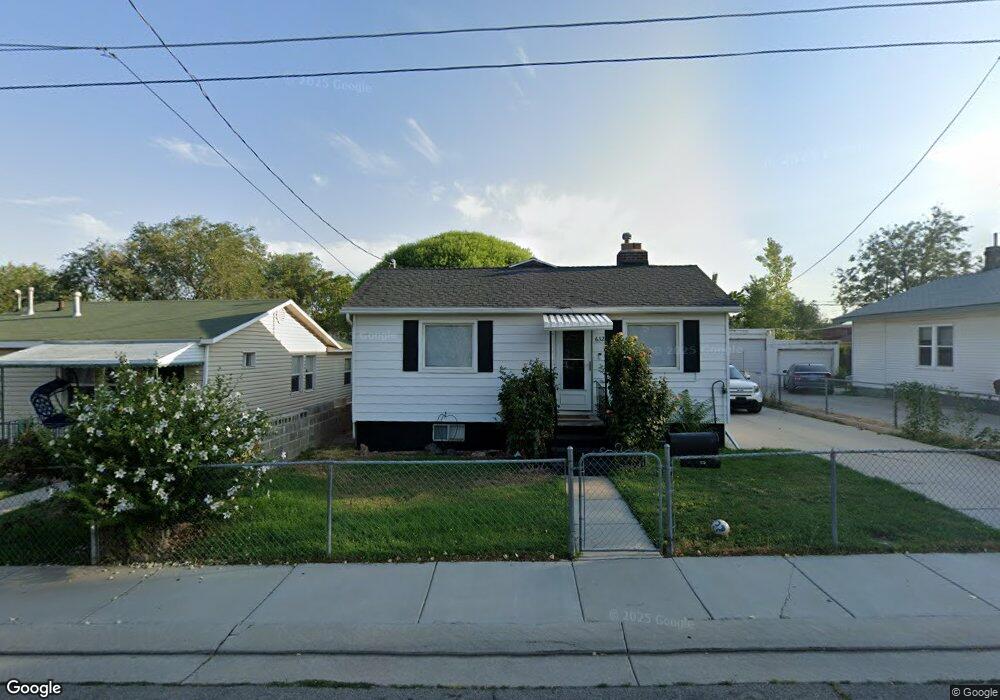
632 W 3rd Ave Midvale, UT 84047
Estimated Value: $387,000 - $470,467
2
Beds
2
Baths
1,505
Sq Ft
$287/Sq Ft
Est. Value
About This Home
This home is located at 632 W 3rd Ave, Midvale, UT 84047 and is currently estimated at $432,617, approximately $287 per square foot. 632 W 3rd Ave is a home located in Salt Lake County with nearby schools including Midvale Elementary School, Midvale Middle School, and Hillcrest High School.
Ownership History
Date
Name
Owned For
Owner Type
Purchase Details
Closed on
Jan 30, 2023
Sold by
Titan Enterprize Pllc
Bought by
Torres Michelle K
Current Estimated Value
Home Financials for this Owner
Home Financials are based on the most recent Mortgage that was taken out on this home.
Original Mortgage
$326,250
Outstanding Balance
$315,977
Interest Rate
6.31%
Mortgage Type
New Conventional
Estimated Equity
$116,641
Purchase Details
Closed on
May 18, 2022
Sold by
Evangeline Benavidez
Bought by
Titan Enterprize Pllc
Home Financials for this Owner
Home Financials are based on the most recent Mortgage that was taken out on this home.
Original Mortgage
$300,000
Interest Rate
5.3%
Mortgage Type
New Conventional
Purchase Details
Closed on
May 16, 2022
Sold by
Evangeline Benavidez
Bought by
Titan Enterprize Pllc
Home Financials for this Owner
Home Financials are based on the most recent Mortgage that was taken out on this home.
Original Mortgage
$300,000
Interest Rate
5.3%
Mortgage Type
New Conventional
Create a Home Valuation Report for This Property
The Home Valuation Report is an in-depth analysis detailing your home's value as well as a comparison with similar homes in the area
Home Values in the Area
Average Home Value in this Area
Purchase History
| Date | Buyer | Sale Price | Title Company |
|---|---|---|---|
| Torres Michelle K | -- | Gt Title | |
| Titan Enterprize Pllc | -- | Highland Title | |
| Titan Enterprize Pllc | -- | Highland Title |
Source: Public Records
Mortgage History
| Date | Status | Borrower | Loan Amount |
|---|---|---|---|
| Open | Torres Michelle K | $326,250 | |
| Previous Owner | Titan Enterprize Pllc | $300,000 | |
| Previous Owner | Titan Enterprize Pllc | $300,000 |
Source: Public Records
Tax History
| Year | Tax Paid | Tax Assessment Tax Assessment Total Assessment is a certain percentage of the fair market value that is determined by local assessors to be the total taxable value of land and additions on the property. | Land | Improvement |
|---|---|---|---|---|
| 2025 | $1,923 | $329,400 | $96,800 | $232,600 |
| 2024 | $1,923 | $328,000 | $91,700 | $236,300 |
| 2023 | $1,890 | $320,200 | $72,900 | $247,300 |
| 2022 | $1,769 | $292,600 | $71,400 | $221,200 |
| 2021 | $1,595 | $226,300 | $63,200 | $163,100 |
| 2020 | $1,511 | $203,200 | $54,100 | $149,100 |
| 2019 | $1,446 | $189,800 | $54,100 | $135,700 |
| 2016 | $1,079 | $134,600 | $45,100 | $89,500 |
Source: Public Records
Map
Nearby Homes
- 620 W 2nd Ave
- 636 W 4th Ave
- 578 7th Ave
- 576 7th Ave
- 7689 Locust St
- 853 W Cannara Way
- 857 W Shelton Way
- 775 Lennox St
- 7923 S Main St Unit 23
- 7346 S Sideline Ln Unit 44
- 7342 S Sideline Ln Unit 45
- 7340 S Sideline Ln Unit 46
- 7373 S Wood Lily Ct Unit 24
- 7369 S Wood Lily Ct Unit 23
- 7338 S Sideline Ln Unit 47
- 7343 S Sideline Ln Unit 49
- 7365 S Wood Lily Ct Unit 22
- 7336 S Sideline Ln Unit 48
- 7341 S Sideline Ln Unit 50
- 7361 S Wood Lily Ct Unit 21
Your Personal Tour Guide
Ask me questions while you tour the home.