632 W 40 N Orem, UT 84057
Suncrest NeighborhoodEstimated Value: $573,000 - $603,000
5
Beds
3
Baths
2,745
Sq Ft
$215/Sq Ft
Est. Value
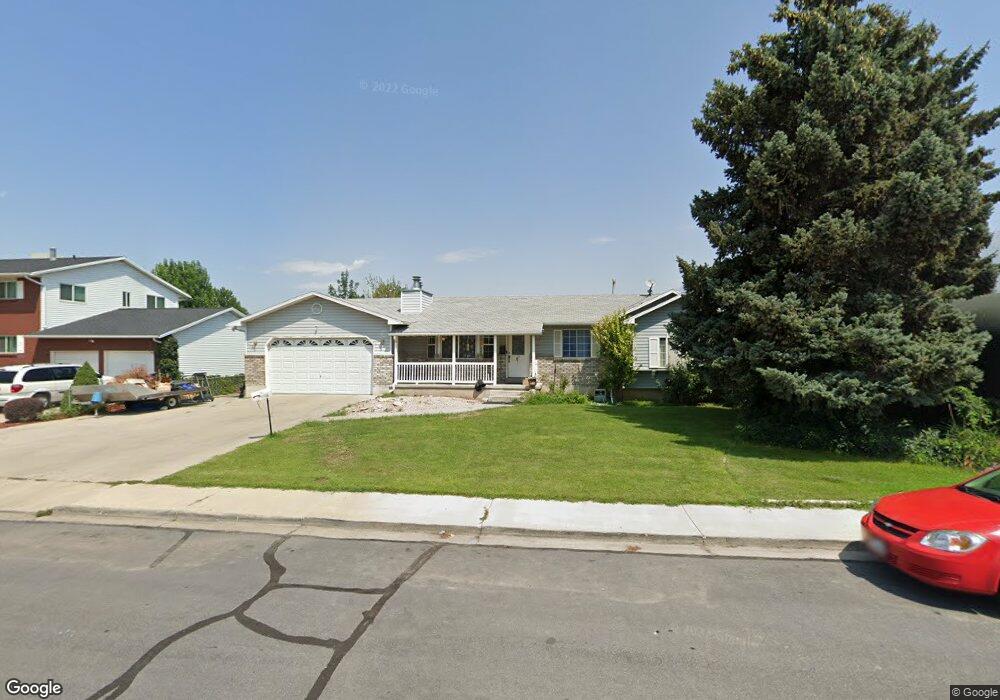
About This Home
This home is located at 632 W 40 N, Orem, UT 84057 and is currently estimated at $590,457, approximately $215 per square foot. 632 W 40 N is a home located in Utah County with nearby schools including Orem Junior High School, Mountain View High School, and Noah Webster Academy.
Ownership History
Date
Name
Owned For
Owner Type
Purchase Details
Closed on
Sep 23, 2005
Sold by
Mickelson Vee Ann and The Vee Ann Mickelson Trust
Bought by
Xuncax Henry and Xuncax Lidia
Current Estimated Value
Purchase Details
Closed on
Jun 15, 2005
Sold by
Mickelson Vee Ann J and Mickelson Bernard L
Bought by
Mickelson Vee Ann and Vee Ann Mickelson Trust
Create a Home Valuation Report for This Property
The Home Valuation Report is an in-depth analysis detailing your home's value as well as a comparison with similar homes in the area
Home Values in the Area
Average Home Value in this Area
Purchase History
| Date | Buyer | Sale Price | Title Company |
|---|---|---|---|
| Xuncax Henry | -- | Equity Title | |
| Mickelson Vee Ann | -- | -- |
Source: Public Records
Tax History
| Year | Tax Paid | Tax Assessment Tax Assessment Total Assessment is a certain percentage of the fair market value that is determined by local assessors to be the total taxable value of land and additions on the property. | Land | Improvement |
|---|---|---|---|---|
| 2025 | $2,193 | $306,295 | -- | -- |
| 2024 | $2,193 | $268,180 | $0 | $0 |
| 2023 | $2,011 | $264,275 | $0 | $0 |
| 2022 | $1,987 | $252,945 | $0 | $0 |
| 2021 | $1,860 | $358,700 | $117,000 | $241,700 |
| 2020 | $1,732 | $328,300 | $93,600 | $234,700 |
| 2019 | $1,588 | $313,000 | $93,600 | $219,400 |
| 2018 | $1,555 | $292,900 | $86,400 | $206,500 |
| 2017 | $1,464 | $147,675 | $0 | $0 |
| 2016 | $1,525 | $141,845 | $0 | $0 |
| 2015 | $1,519 | $133,650 | $0 | $0 |
| 2014 | $1,511 | $132,330 | $0 | $0 |
Source: Public Records
Map
Nearby Homes
Your Personal Tour Guide
Ask me questions while you tour the home.