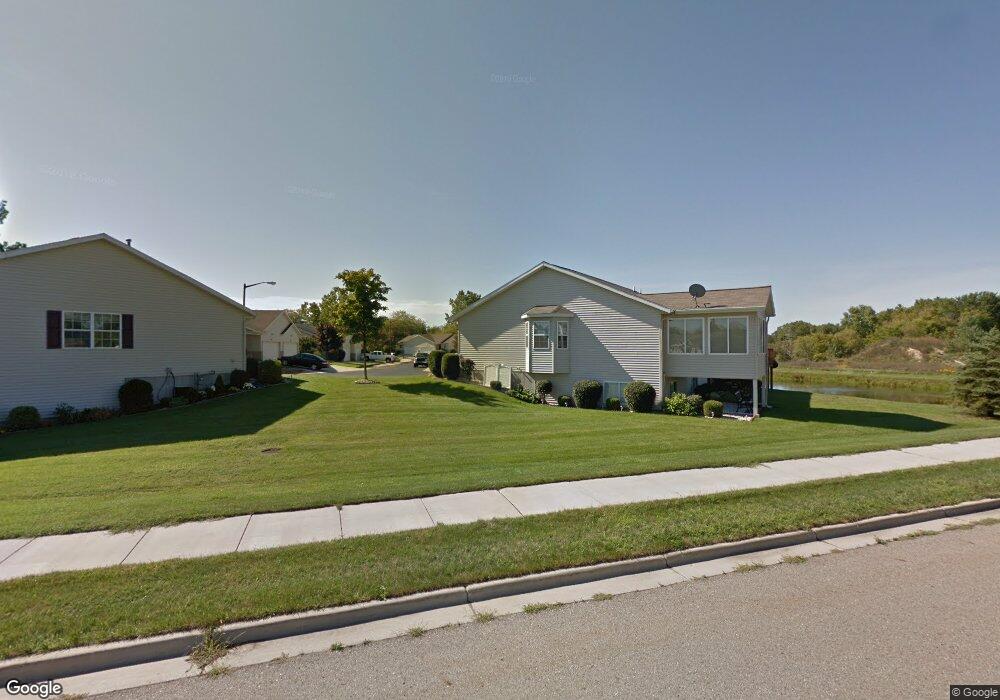
632 Wilshire Ct Holland, MI 49423
Maplewood NeighborhoodEstimated Value: $227,000 - $252,015
2
Beds
2
Baths
1,345
Sq Ft
$180/Sq Ft
Est. Value
About This Home
This home is located at 632 Wilshire Ct, Holland, MI 49423 and is currently estimated at $241,754, approximately $179 per square foot. 632 Wilshire Ct is a home located in Ottawa County with nearby schools including Maplewood, Holland Middle School, and Holland High School.
Ownership History
Date
Name
Owned For
Owner Type
Purchase Details
Closed on
Dec 28, 2020
Sold by
Beverly J Lundie Declaration Of Trusts
Bought by
Dekraker Todd
Current Estimated Value
Home Financials for this Owner
Home Financials are based on the most recent Mortgage that was taken out on this home.
Original Mortgage
$152,000
Outstanding Balance
$135,637
Interest Rate
2.7%
Mortgage Type
New Conventional
Estimated Equity
$106,117
Purchase Details
Closed on
Dec 26, 2020
Sold by
Dekraker Todd
Bought by
Dekraker Todd and Dekraker Julie
Home Financials for this Owner
Home Financials are based on the most recent Mortgage that was taken out on this home.
Original Mortgage
$152,000
Outstanding Balance
$135,637
Interest Rate
2.7%
Mortgage Type
New Conventional
Estimated Equity
$106,117
Purchase Details
Closed on
Jul 20, 2018
Sold by
Lundie Beverly and Lundie William
Bought by
Lundic Beverly
Purchase Details
Closed on
Dec 28, 1998
Sold by
Ver-Bre Dev Llc
Bought by
Lundie William
Purchase Details
Closed on
Oct 9, 1997
Sold by
Versendaal Cornelius
Bought by
Ver-Bre Development
Create a Home Valuation Report for This Property
The Home Valuation Report is an in-depth analysis detailing your home's value as well as a comparison with similar homes in the area
Home Values in the Area
Average Home Value in this Area
Purchase History
| Date | Buyer | Sale Price | Title Company |
|---|---|---|---|
| Dekraker Todd | $160,000 | Chicago Title Of Mi Inc | |
| Dekraker Todd | -- | Chicago Title Of Michigan In | |
| Lundic Beverly | -- | None Available | |
| Lundie William | $111,500 | -- | |
| Ver-Bre Development | -- | -- |
Source: Public Records
Mortgage History
| Date | Status | Borrower | Loan Amount |
|---|---|---|---|
| Open | Dekraker Todd | $152,000 |
Source: Public Records
Tax History Compared to Growth
Tax History
| Year | Tax Paid | Tax Assessment Tax Assessment Total Assessment is a certain percentage of the fair market value that is determined by local assessors to be the total taxable value of land and additions on the property. | Land | Improvement |
|---|---|---|---|---|
| 2025 | $3,954 | $126,900 | $0 | $0 |
| 2024 | $3,815 | $117,500 | $0 | $0 |
| 2023 | $3,677 | $89,000 | $0 | $0 |
| 2022 | $3,512 | $90,200 | $0 | $0 |
| 2021 | $3,415 | $81,800 | $0 | $0 |
| 2020 | $3,058 | $79,200 | $0 | $0 |
| 2019 | $3,035 | $77,400 | $0 | $0 |
| 2018 | $2,897 | $68,900 | $0 | $0 |
| 2017 | $2,817 | $68,900 | $0 | $0 |
| 2016 | $2,817 | $56,400 | $0 | $0 |
| 2015 | $1,905 | $50,300 | $0 | $0 |
| 2014 | $1,905 | $46,800 | $0 | $0 |
Source: Public Records
Map
Nearby Homes
- 603 Apple Ave
- 421 E 32nd St
- 625 Maple Creek Dr Unit 35
- 796 Holly Creek Dr
- 317 Maple Creek Ct
- 840 Harvest Dr Unit 30
- 561 Century Ln
- 551 Century Ln
- 541 Century Ln
- 650 Lincoln Ave
- 195 E 28th St
- 172 E 25th St
- 199 E 34th St Unit 10
- 202 E 34th St
- 648 Columbia Ave
- 533 Columbia Ave Unit 152
- 970 Sagewood Ct Unit 4
- 171 E 37th St
- 866 E 24th St Unit Parcel A
- 544 College Ave
- 634 Wilshire Ct
- 633 Wilshire Ct
- 635 Wilshire Ct Unit 16
- 638 Wilshire Ct
- 639 Wilshire Ct
- 639 Wilshire Ct Unit 17
- 465 Ida Red Pkwy
- 640 Wilshire Ct
- 467 Ida Red Pkwy
- 641 Wilshire Ct
- 641 Wilshire Ct Unit 18
- 455 Ida Red Pkwy
- 485 Ida Red Pkwy
- 483 Ida Red Pkwy
- 479 Ida Red Pkwy
- 477 Ida Red Pkwy
- 453 Ida Red Pkwy
- 473 Ida Red Pkwy
- 471 Ida Red Pkwy
- 644 Wilshire Ct