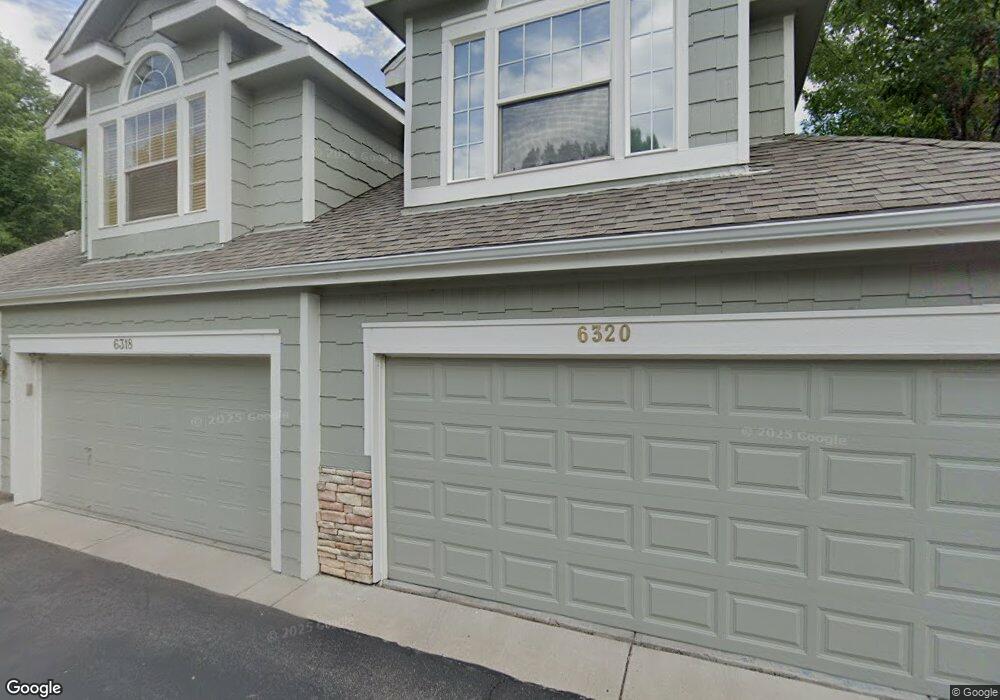
6320 Deframe Way Arvada, CO 80004
Ralston Valley NeighborhoodEstimated Value: $596,000 - $615,940
3
Beds
3
Baths
2,187
Sq Ft
$278/Sq Ft
Est. Value
About This Home
This home is located at 6320 Deframe Way, Arvada, CO 80004 and is currently estimated at $608,235, approximately $278 per square foot. 6320 Deframe Way is a home located in Jefferson County with nearby schools including Fremont Elementary School, Drake Junior High School, and Arvada West High School.
Ownership History
Date
Name
Owned For
Owner Type
Purchase Details
Closed on
Feb 14, 2020
Sold by
Cox Judith D and Cox Carl R
Bought by
Sprinkle Shauna K
Current Estimated Value
Purchase Details
Closed on
Jan 9, 2009
Sold by
Williams Lawrence D and Williams Debra L
Bought by
Cox Judith D and Cox Carl R
Purchase Details
Closed on
Feb 15, 2001
Sold by
Sandra Campbell Allen C Campbell
Bought by
Williams Lawrence D and Williams Debra L
Home Financials for this Owner
Home Financials are based on the most recent Mortgage that was taken out on this home.
Original Mortgage
$234,000
Interest Rate
6.85%
Purchase Details
Closed on
Feb 24, 2000
Sold by
Village Homes Of Colorado Inc
Bought by
Campbell Allen C and Campbell Sandra
Home Financials for this Owner
Home Financials are based on the most recent Mortgage that was taken out on this home.
Original Mortgage
$100,000
Interest Rate
8.31%
Create a Home Valuation Report for This Property
The Home Valuation Report is an in-depth analysis detailing your home's value as well as a comparison with similar homes in the area
Home Values in the Area
Average Home Value in this Area
Purchase History
| Date | Buyer | Sale Price | Title Company |
|---|---|---|---|
| Sprinkle Shauna K | $462,500 | Land Title Guarantee | |
| Cox Judith D | $280,000 | Land Title Guarantee Company | |
| Williams Lawrence D | $260,000 | Land Title Guarantee Company | |
| Campbell Allen C | $217,727 | Land Title |
Source: Public Records
Mortgage History
| Date | Status | Borrower | Loan Amount |
|---|---|---|---|
| Previous Owner | Williams Lawrence D | $234,000 | |
| Previous Owner | Campbell Allen C | $100,000 |
Source: Public Records
Tax History
| Year | Tax Paid | Tax Assessment Tax Assessment Total Assessment is a certain percentage of the fair market value that is determined by local assessors to be the total taxable value of land and additions on the property. | Land | Improvement |
|---|---|---|---|---|
| 2024 | $3,090 | $31,857 | $7,555 | $24,302 |
| 2023 | $3,090 | $31,857 | $7,555 | $24,302 |
| 2022 | $2,605 | $26,605 | $3,643 | $22,962 |
| 2021 | $2,649 | $27,371 | $3,748 | $23,623 |
| 2020 | $2,430 | $25,179 | $6,349 | $18,830 |
| 2019 | $2,397 | $25,179 | $6,349 | $18,830 |
| 2018 | $2,149 | $21,946 | $3,890 | $18,056 |
| 2017 | $1,967 | $21,946 | $3,890 | $18,056 |
| 2016 | $2,112 | $22,199 | $4,974 | $17,225 |
| 2015 | $2,153 | $22,199 | $4,974 | $17,225 |
| 2014 | $2,153 | $21,269 | $4,012 | $17,257 |
Source: Public Records
Map
Nearby Homes
- 6304 Deframe Way
- 13509 W 62nd Dr
- 6329 Braun Cir
- 6369 Cole Ln
- 13571 W 61st Ln
- 13812 W 64th Place
- 6262 Braun Cir
- 13750 W 65th Ave
- 13275 W 63rd Place
- 13155 W 63rd Place
- 6069 Zinnia St
- 13352 W 65th Place
- 13334 W 65th Dr
- 13294 W 65th Dr
- 12995 W 63rd Place Unit A
- 6658 Cole Ct
- 6053 Youngfield St
- 12321 W 58th Dr
- 6725 Beech Ct
- 5276 Flora Way
- 6318 Deframe Way
- 6326 Deframe Way
- 6328 Deframe Way
- 6322 Deframe Way
- 6324 Deframe Way
- 6330 Deframe Way
- 6332 Deframe Way
- 13624 W 63rd Cir
- 6314 Deframe Way
- 13634 W 63rd Cir
- 6315 Deframe Way
- 6313 Deframe Way
- 6317 Deframe Way
- 13614 W 63rd Cir
- 6319 Deframe Way
- 6325 Deframe Way
- 6323 Deframe Way
- 6334 Deframe Way
- 6336 Deframe Way
- 6306 Deframe Way
Your Personal Tour Guide
Ask me questions while you tour the home.