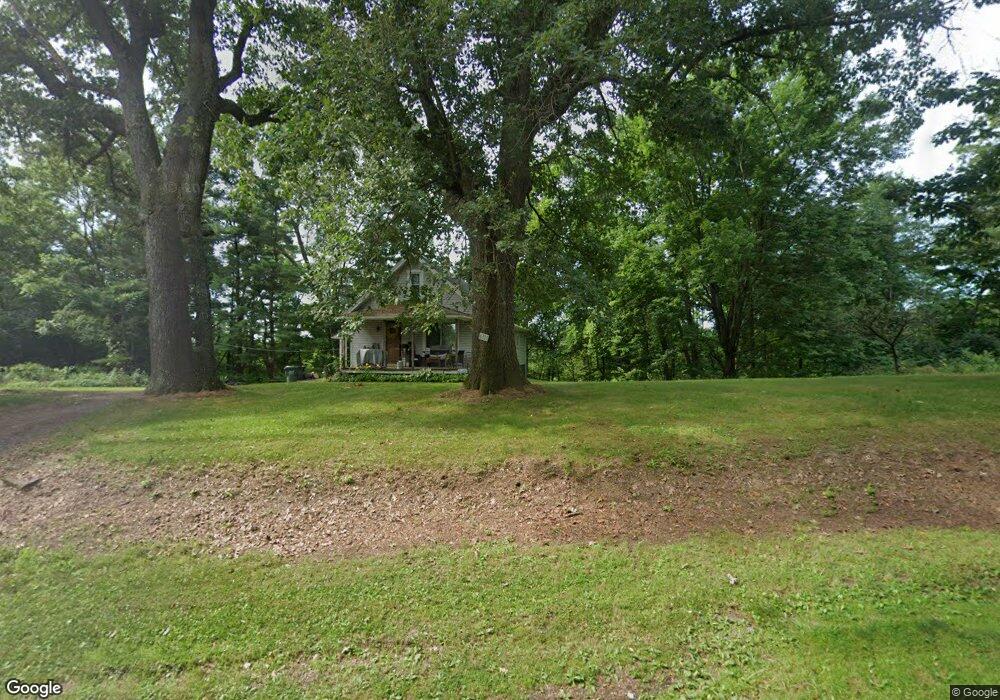
6320 Westfall St SE Waynesburg, OH 44688
Estimated Value: $145,000 - $220,220
4
Beds
2
Baths
1,397
Sq Ft
$126/Sq Ft
Est. Value
About This Home
This home is located at 6320 Westfall St SE, Waynesburg, OH 44688 and is currently estimated at $176,555, approximately $126 per square foot. 6320 Westfall St SE is a home located in Stark County with nearby schools including East Canton Elementary School, East Canton Middle School, and East Canton High School.
Ownership History
Date
Name
Owned For
Owner Type
Purchase Details
Closed on
Dec 13, 2007
Sold by
Croston Daniel S
Bought by
Croston Laura L and Croston Daniel S
Current Estimated Value
Home Financials for this Owner
Home Financials are based on the most recent Mortgage that was taken out on this home.
Original Mortgage
$102,000
Outstanding Balance
$64,595
Interest Rate
6.31%
Mortgage Type
New Conventional
Estimated Equity
$111,960
Purchase Details
Closed on
May 22, 2006
Sold by
Croston Camden and Croston Susan
Bought by
Croston Daniel S
Home Financials for this Owner
Home Financials are based on the most recent Mortgage that was taken out on this home.
Original Mortgage
$93,600
Interest Rate
11.5%
Mortgage Type
Fannie Mae Freddie Mac
Purchase Details
Closed on
Jul 23, 1993
Create a Home Valuation Report for This Property
The Home Valuation Report is an in-depth analysis detailing your home's value as well as a comparison with similar homes in the area
Home Values in the Area
Average Home Value in this Area
Purchase History
| Date | Buyer | Sale Price | Title Company |
|---|---|---|---|
| Croston Laura L | -- | Attorney | |
| Croston Daniel S | $82,600 | Netwide Title Agency Inc | |
| -- | $47,000 | -- |
Source: Public Records
Mortgage History
| Date | Status | Borrower | Loan Amount |
|---|---|---|---|
| Open | Croston Laura L | $102,000 | |
| Closed | Croston Daniel S | $93,600 |
Source: Public Records
Tax History Compared to Growth
Tax History
| Year | Tax Paid | Tax Assessment Tax Assessment Total Assessment is a certain percentage of the fair market value that is determined by local assessors to be the total taxable value of land and additions on the property. | Land | Improvement |
|---|---|---|---|---|
| 2025 | -- | $63,180 | $29,510 | $33,670 |
| 2024 | -- | $63,180 | $29,510 | $33,670 |
| 2023 | $1,622 | $43,160 | $18,730 | $24,430 |
| 2022 | $1,587 | $43,160 | $18,730 | $24,430 |
| 2021 | $1,593 | $43,160 | $18,730 | $24,430 |
| 2020 | $1,624 | $40,050 | $17,120 | $22,930 |
| 2019 | $1,593 | $40,050 | $17,120 | $22,930 |
| 2018 | $1,577 | $40,050 | $17,120 | $22,930 |
| 2017 | $1,555 | $36,160 | $17,920 | $18,240 |
| 2016 | $1,563 | $36,160 | $17,920 | $18,240 |
| 2015 | $1,577 | $36,160 | $17,920 | $18,240 |
| 2014 | $1,490 | $31,120 | $15,440 | $15,680 |
| 2013 | $1,498 | $31,120 | $15,440 | $15,680 |
Source: Public Records
Map
Nearby Homes
- 5666 Circlevale St SE
- 7205 Mapleton St SE
- 6805 Waynesburg Dr SE
- 0000 Sandy Ave SE
- 5236 Martin Dr SE
- 2802 Trump Ave SE
- 7678 Waynesburg Dr SE
- 7750 Waynesburg Dr SE
- 7803 Elson St SE
- 1527 Johns Ave SE
- 0 Lincoln St SE Unit 5157308
- 0 Lincoln St SE Unit 5157344
- 0 Lincoln St SE Unit 5157290
- 5488 Elson St SE
- 7145 Bluebird Rd NW
- 229 Liberty St W
- 2511 Sherr Ave SE
- 0 Neimans Ave SE Unit 5149957
- 233 Nassau St W
- 223 Nassau St W
- 6296 Westfall St SE
- 6171 Westfall St SE
- 6445 Westfall St SE
- 0 Fairhill St SE Unit 4360097
- 6379 Fairhill St SE
- 6636 Westfall St SE
- 6481 Fairhill St SE
- 5956 Westfall St SE
- 5956 Westfall St SE
- 4865 Indian Run Ave SE
- 4681 Indian Run Ave SE
- 6520 Fairhill St SE
- 5835 Fairhill St SE
- 5881 Westfall St SE
- 6579 Fairhill St SE
- 6426 Circlevale St SE
- 5825 Fairhill St SE
- 6556 Fairhill St SE
- 5861 Westfall St SE
- 5141 Indian Run Ave SE