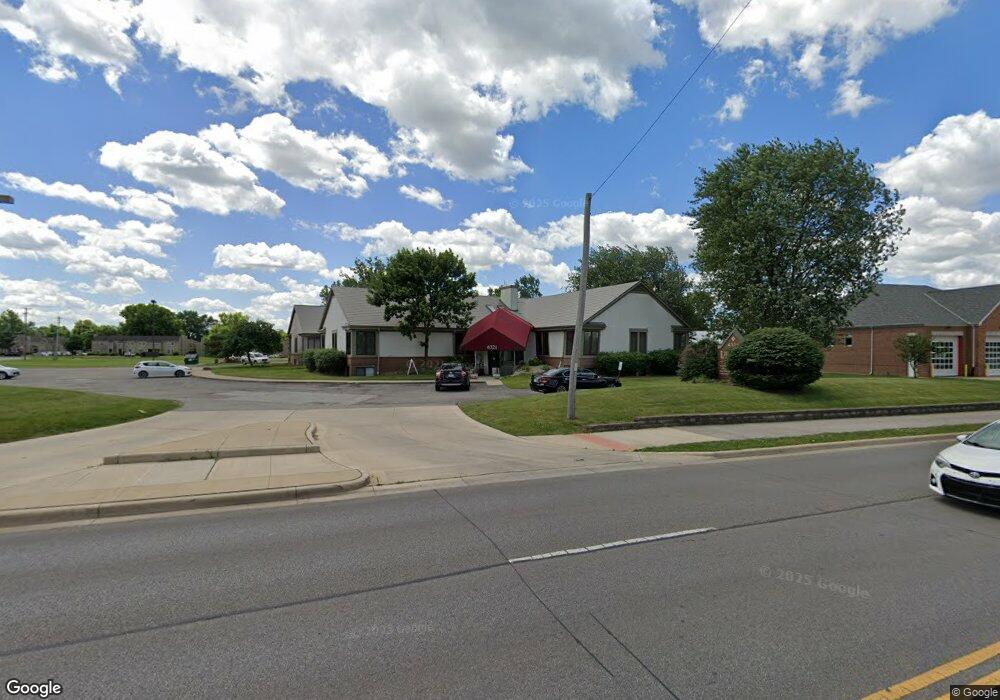
6321 E Livingston Ave Unit B Reynoldsburg, OH 43068
Estimated Value: $554,425
--
Bed
--
Bath
9,234
Sq Ft
$60/Sq Ft
Est. Value
About This Home
This home is located at 6321 E Livingston Ave Unit B, Reynoldsburg, OH 43068 and is currently estimated at $554,425, approximately $60 per square foot. 6321 E Livingston Ave Unit B is a home located in Franklin County with nearby schools including Slate Ridge Elementary School, Baldwin Road Junior High School, and Hannah J Ashton Middle School.
Ownership History
Date
Name
Owned For
Owner Type
Purchase Details
Closed on
Jun 29, 2022
Sold by
Paul M Loper Living Trust
Bought by
Schapman Enterprises Llc
Current Estimated Value
Home Financials for this Owner
Home Financials are based on the most recent Mortgage that was taken out on this home.
Original Mortgage
$466,700
Outstanding Balance
$435,295
Interest Rate
5.23%
Mortgage Type
New Conventional
Estimated Equity
$119,130
Purchase Details
Closed on
Mar 19, 2009
Sold by
Loper Paul M and Loper Judy F
Bought by
Paul M Loper Living Trust
Purchase Details
Closed on
Feb 1, 1993
Bought by
Loper Paul M and Loper Judy F
Purchase Details
Closed on
Sep 10, 1992
Create a Home Valuation Report for This Property
The Home Valuation Report is an in-depth analysis detailing your home's value as well as a comparison with similar homes in the area
Home Values in the Area
Average Home Value in this Area
Purchase History
| Date | Buyer | Sale Price | Title Company |
|---|---|---|---|
| Schapman Enterprises Llc | $500,000 | Omni Title | |
| Paul M Loper Living Trust | -- | Attorney | |
| Loper Paul M | $305,500 | -- | |
| -- | -- | -- |
Source: Public Records
Mortgage History
| Date | Status | Borrower | Loan Amount |
|---|---|---|---|
| Open | Schapman Enterprises Llc | $466,700 |
Source: Public Records
Tax History Compared to Growth
Tax History
| Year | Tax Paid | Tax Assessment Tax Assessment Total Assessment is a certain percentage of the fair market value that is determined by local assessors to be the total taxable value of land and additions on the property. | Land | Improvement |
|---|---|---|---|---|
| 2024 | $12,774 | $156,140 | $105,460 | $50,680 |
| 2023 | $12,294 | $156,140 | $105,460 | $50,680 |
| 2022 | $12,222 | $138,950 | $63,280 | $75,670 |
| 2021 | $12,267 | $138,950 | $63,280 | $75,670 |
| 2020 | $12,414 | $138,950 | $63,280 | $75,670 |
| 2019 | $12,148 | $132,310 | $60,240 | $72,070 |
| 2018 | $6,051 | $132,310 | $60,240 | $72,070 |
| 2017 | $12,080 | $132,310 | $60,240 | $72,070 |
| 2016 | $11,408 | $115,500 | $60,270 | $55,230 |
| 2015 | $5,537 | $115,500 | $60,270 | $55,230 |
| 2014 | $11,113 | $115,500 | $60,270 | $55,230 |
| 2013 | $9,034 | $192,500 | $60,270 | $132,230 |
Source: Public Records
Map
Nearby Homes
- 6348 E Livingston Ave
- 0 Brice Rd
- 0 Radekin Rd Unit 225029852
- 2186 Leah Ln
- 6004 Radekin Rd
- 6682 Woodsedge Dr
- 6728 Greenbush Dr
- 6772 Gilette Dr
- 6784 Greenbush Dr
- 1334 Manor Dr
- 1328 Manor Dr
- 1930 Walnut Hill Park Dr
- 1888 Birkdale Dr
- 6863 Gilette Dr
- 6793 Laird Ave
- 1481 Riverton Ct E
- 1591 Stephanie Ct Unit 15912
- 5781 Hallridge Cir Unit B
- 1638 Parkinson Dr
- 1826-1828 Bairsford Dr
- 6321 E Livingston Ave
- 6321 E Livingston Ave Unit E
- 6321 E Livingston Ave Unit C
- 6326 E Livingston Ave
- 1918 Briceton Dr
- 1920 Briceton Dr
- 6348 Blackhaw Dr
- 6392 Blackhaw Dr Unit 394
- 6358 E Livingston Ave
- 1873 Steckel Rd
- 1954 Briceton Dr Unit 956
- 1954 Briceton Dr Unit 56
- 1954-1956 Briceton Dr Unit 56
- 6400 Blackhaw Dr
- 1863 Steckel Rd
- 6401 Blackhaw Dr
- 6394 Birchview Dr N
- 6415 E Livingston Ave
- 1857 Steckel Rd
- 1860 Steckel Rd