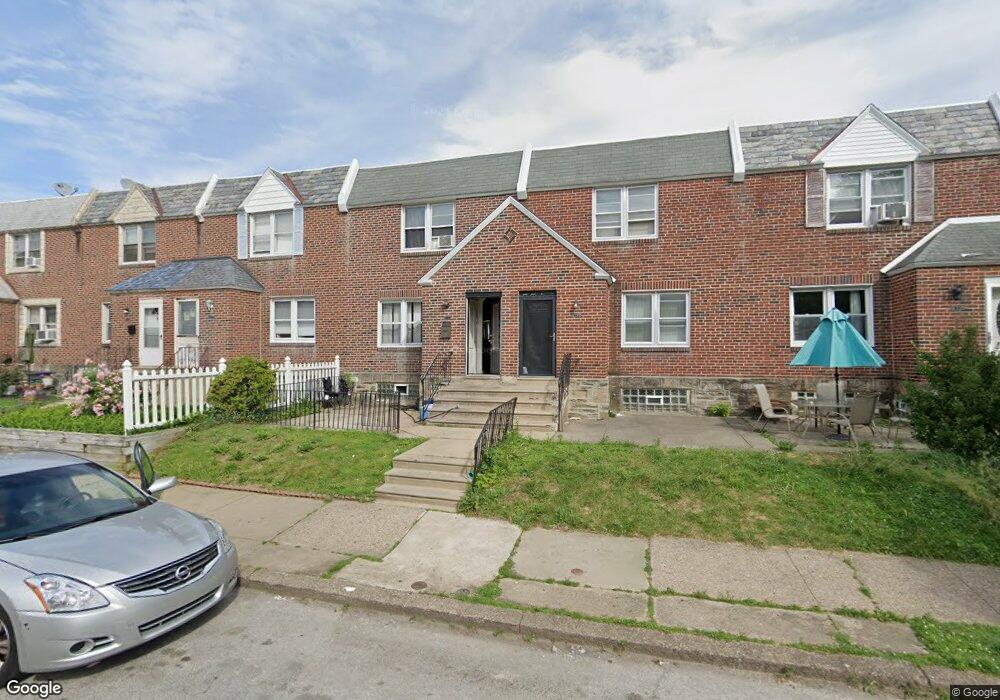
6321 Elmhurst St Philadelphia, PA 19111
Castor Gardens NeighborhoodEstimated Value: $204,000 - $229,840
3
Beds
2
Baths
1,278
Sq Ft
$173/Sq Ft
Est. Value
About This Home
This home is located at 6321 Elmhurst St, Philadelphia, PA 19111 and is currently estimated at $221,210, approximately $173 per square foot. 6321 Elmhurst St is a home located in Philadelphia County with nearby schools including Laura H Carnell School, Harding Warren G Middle School, and Samuel Fels High School.
Ownership History
Date
Name
Owned For
Owner Type
Purchase Details
Closed on
Oct 25, 2016
Sold by
Wells Fargo Bank Na
Bought by
Hang Nguyen Bang
Current Estimated Value
Purchase Details
Closed on
Apr 5, 2016
Sold by
Tolliver Aziz and Tolliver Robin
Bought by
Wells Fargo Bank N A
Purchase Details
Closed on
Jun 27, 2002
Sold by
Shaw Taneesha
Bought by
Tolliver Aziz and Tolliver Robin
Home Financials for this Owner
Home Financials are based on the most recent Mortgage that was taken out on this home.
Original Mortgage
$71,200
Interest Rate
6.82%
Mortgage Type
FHA
Purchase Details
Closed on
Jun 23, 2000
Sold by
Snyder Ronald W and Snyder Jane Marie
Bought by
Shaw Taneesha
Home Financials for this Owner
Home Financials are based on the most recent Mortgage that was taken out on this home.
Original Mortgage
$61,850
Interest Rate
8.5%
Mortgage Type
FHA
Create a Home Valuation Report for This Property
The Home Valuation Report is an in-depth analysis detailing your home's value as well as a comparison with similar homes in the area
Home Values in the Area
Average Home Value in this Area
Purchase History
| Date | Buyer | Sale Price | Title Company |
|---|---|---|---|
| Hang Nguyen Bang | $67,000 | None Available | |
| Wells Fargo Bank N A | $66,000 | None Available | |
| Tolliver Aziz | $71,780 | -- | |
| Shaw Taneesha | $61,900 | -- |
Source: Public Records
Mortgage History
| Date | Status | Borrower | Loan Amount |
|---|---|---|---|
| Previous Owner | Tolliver Aziz | $71,200 | |
| Previous Owner | Shaw Taneesha | $61,850 |
Source: Public Records
Tax History Compared to Growth
Tax History
| Year | Tax Paid | Tax Assessment Tax Assessment Total Assessment is a certain percentage of the fair market value that is determined by local assessors to be the total taxable value of land and additions on the property. | Land | Improvement |
|---|---|---|---|---|
| 2025 | $2,431 | $209,300 | $41,860 | $167,440 |
| 2024 | $2,431 | $209,300 | $41,860 | $167,440 |
| 2023 | $2,431 | $173,700 | $34,740 | $138,960 |
| 2022 | $1,603 | $173,700 | $34,740 | $138,960 |
| 2021 | $1,603 | $0 | $0 | $0 |
| 2020 | $1,603 | $0 | $0 | $0 |
| 2019 | $1,538 | $0 | $0 | $0 |
| 2018 | $1,536 | $0 | $0 | $0 |
| 2017 | $1,536 | $0 | $0 | $0 |
| 2016 | $1,536 | $0 | $0 | $0 |
| 2015 | $1,470 | $0 | $0 | $0 |
| 2014 | -- | $109,700 | $21,170 | $88,530 |
| 2012 | -- | $14,688 | $2,143 | $12,545 |
Source: Public Records
Map
Nearby Homes
- 6317 Elmhurst St
- 6222 Algon Ave
- 6232 Summerdale Ave
- 6230 Summerdale Ave
- 1128 Elbridge St
- 1216 Hellerman St
- 1113 Gilham St
- 1139 Elbridge St
- 1135 Gilham St
- 1102 Magee Ave
- 1141 Gilham St
- 1130 Magee Ave
- 1237 Hellerman St
- 1223 Greeby St
- 1217 Hale St
- 6340 Martins Mill Rd
- 1238 Gilham St
- 1227 Hale St
- 1104 Fanshawe St
- 1154 Devereaux Ave
- 6323 Elmhurst St
- 6319 Elmhurst St
- 6327 Elmhurst St
- 6329 Elmhurst St
- 6331 Elmhurst St
- 6315 Elmhurst St
- 6322 Langdon St
- 6324 Langdon St
- 6320 Langdon St
- 6333 Elmhurst St
- 6326 Langdon St
- 6318 Langdon St
- 6313 Elmhurst St
- 6316 Langdon St
- 6328 Langdon St
- 6335 Elmhurst St
- 6330 Langdon St
- 6314 Langdon St
- 6311 Elmhurst St
- 6332 Langdon St