Estimated Value: $279,000 - $336,000
2
Beds
1
Bath
1,054
Sq Ft
$292/Sq Ft
Est. Value
About This Home
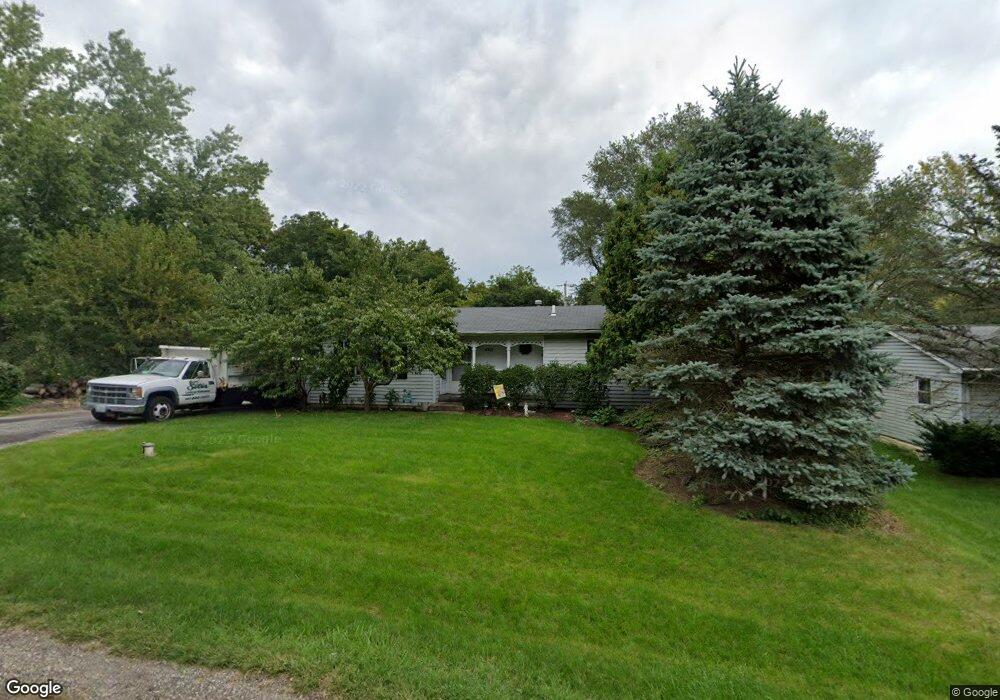
This home is located at 6322 Hillcrest Rd, Cary, IL 60013 and is currently estimated at $308,094, approximately $292 per square foot. 6322 Hillcrest Rd is a home located in McHenry County with nearby schools including Deer Path Elementary School, Cary Jr High School, and Cary Grove High School.
Ownership History
Date
Name
Owned For
Owner Type
Purchase Details
Closed on
May 8, 2001
Sold by
Silis Miguel
Bought by
Silis Raul I and Silis Beatriz Gomez
Current Estimated Value
Home Financials for this Owner
Home Financials are based on the most recent Mortgage that was taken out on this home.
Original Mortgage
$133,000
Outstanding Balance
$49,809
Interest Rate
7.07%
Estimated Equity
$258,285
Purchase Details
Closed on
May 31, 2000
Sold by
Bolich Marian
Bought by
Silis Raul I and Silis Miguel
Home Financials for this Owner
Home Financials are based on the most recent Mortgage that was taken out on this home.
Original Mortgage
$131,084
Interest Rate
8.18%
Mortgage Type
FHA
Purchase Details
Closed on
Feb 25, 1999
Sold by
Bolich Albert and Bolich Marian
Bought by
Bolich Marian
Home Financials for this Owner
Home Financials are based on the most recent Mortgage that was taken out on this home.
Original Mortgage
$138,500
Interest Rate
6.8%
Create a Home Valuation Report for This Property
The Home Valuation Report is an in-depth analysis detailing your home's value as well as a comparison with similar homes in the area
Home Values in the Area
Average Home Value in this Area
Purchase History
| Date | Buyer | Sale Price | Title Company |
|---|---|---|---|
| Silis Raul I | -- | Chicago Title Insurance Co | |
| Silis Raul I | $132,000 | First American | |
| Bolich Marian | -- | Stewart Title Company |
Source: Public Records
Mortgage History
| Date | Status | Borrower | Loan Amount |
|---|---|---|---|
| Open | Silis Raul I | $133,000 | |
| Closed | Silis Raul I | $131,084 | |
| Previous Owner | Bolich Marian | $138,500 |
Source: Public Records
Tax History Compared to Growth
Tax History
| Year | Tax Paid | Tax Assessment Tax Assessment Total Assessment is a certain percentage of the fair market value that is determined by local assessors to be the total taxable value of land and additions on the property. | Land | Improvement |
|---|---|---|---|---|
| 2024 | $5,742 | $86,598 | $12,703 | $73,895 |
| 2023 | $5,598 | $77,451 | $11,361 | $66,090 |
| 2022 | $5,016 | $67,302 | $12,977 | $54,325 |
| 2021 | $4,769 | $62,700 | $12,090 | $50,610 |
| 2020 | $4,619 | $60,480 | $11,662 | $48,818 |
| 2019 | $4,522 | $57,887 | $11,162 | $46,725 |
| 2018 | $4,163 | $52,579 | $10,311 | $42,268 |
| 2017 | $4,072 | $49,533 | $9,714 | $39,819 |
| 2016 | $4,033 | $46,458 | $9,111 | $37,347 |
| 2013 | -- | $43,939 | $8,499 | $35,440 |
Source: Public Records
Map
Nearby Homes
- 6316 Hilly Way
- 6310 Hilly Way
- 6317 W Rawson Bridge Rd
- 2610 Killarney Dr
- 14 Lakewood Dr
- 2819 Sun Valley Dr
- 1415 Carmel Ln
- 216 Hickory Rd
- 5511 Greenview Rd
- 9 Bordeaux Ct
- 322 Parkstone Dr
- 296 Foxford Dr Unit 1
- 4 Bernay Ct
- 3408 Royal Woods Dr
- 331 Parkstone Dr
- 1 Calais Ct
- 20 Willow Cir
- 6123 S Kilkenny Dr
- 0 Three Oaks Dr Unit MRD12417647
- 3514 E Crystal Lake Ave
- 6316 Hillcrest Rd
- 6319 Hillcrest Rd
- 6321 Hillcrest Rd
- 6314 Hillcrest Rd
- 6317 Hillcrest Rd
- 6325 Hillcrest Rd
- 6315 Hillcrest Rd
- 6312 Hillcrest Rd
- 6318 Hilly Way
- 6310 Hillcrest Rd
- 6311 Hillcrest Rd
- 6324 Hilly Way
- 6406 Hillcrest Rd
- 2411 Rona St
- 2409 Rona St
- 6405 W Rawson Bridge Rd
- 6314 Hilly Way
- 6405 Hillcrest Rd
- 6308 Hillcrest Rd
- 6312 Hilly Way