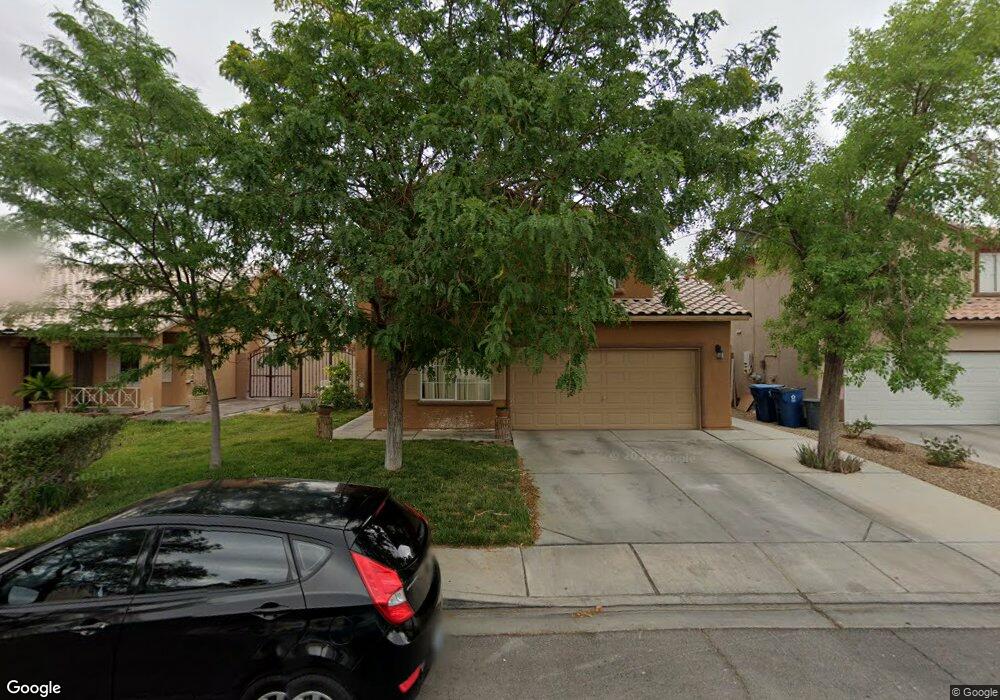
6325 Berry Patch Way Las Vegas, NV 89142
Estimated Value: $445,282 - $467,000
4
Beds
3
Baths
2,168
Sq Ft
$211/Sq Ft
Est. Value
About This Home
This home is located at 6325 Berry Patch Way, Las Vegas, NV 89142 and is currently estimated at $457,821, approximately $211 per square foot. 6325 Berry Patch Way is a home located in Clark County with nearby schools including Dan Goldfarb Elementary School, Kathleen & Tim Harney Middle School, and Las Vegas High School.
Ownership History
Date
Name
Owned For
Owner Type
Purchase Details
Closed on
Mar 14, 2019
Sold by
Valencia Jose Rodriguez and Rodriguez Martha
Bought by
Mendez Andrade Miguel and Mendez Azucenn
Current Estimated Value
Purchase Details
Closed on
Nov 17, 2016
Sold by
Rodriguez Jose V and Rodriguez Martha
Bought by
Valencia Jose Rodriguez and Rodriguez Matha
Home Financials for this Owner
Home Financials are based on the most recent Mortgage that was taken out on this home.
Original Mortgage
$144,230
Interest Rate
3.47%
Mortgage Type
New Conventional
Purchase Details
Closed on
Apr 17, 1997
Sold by
Lewis Properties
Bought by
Rodriguez Jose and Rodriguez Martha
Home Financials for this Owner
Home Financials are based on the most recent Mortgage that was taken out on this home.
Original Mortgage
$129,150
Interest Rate
7.86%
Create a Home Valuation Report for This Property
The Home Valuation Report is an in-depth analysis detailing your home's value as well as a comparison with similar homes in the area
Home Values in the Area
Average Home Value in this Area
Purchase History
| Date | Buyer | Sale Price | Title Company |
|---|---|---|---|
| Mendez Andrade Miguel | -- | None Available | |
| Valencia Jose Rodriguez | -- | None Available | |
| Rodriguez Jose | $136,000 | Land Title |
Source: Public Records
Mortgage History
| Date | Status | Borrower | Loan Amount |
|---|---|---|---|
| Previous Owner | Valencia Jose Rodriguez | $144,230 | |
| Previous Owner | Rodriguez Jose | $129,150 |
Source: Public Records
Tax History Compared to Growth
Tax History
| Year | Tax Paid | Tax Assessment Tax Assessment Total Assessment is a certain percentage of the fair market value that is determined by local assessors to be the total taxable value of land and additions on the property. | Land | Improvement |
|---|---|---|---|---|
| 2025 | $1,814 | $94,835 | $24,850 | $69,985 |
| 2024 | $1,680 | $94,835 | $24,850 | $69,985 |
| 2023 | $1,680 | $95,313 | $28,700 | $66,613 |
| 2022 | $1,556 | $84,382 | $23,450 | $60,932 |
| 2021 | $1,441 | $79,357 | $21,350 | $58,007 |
| 2020 | $1,335 | $78,283 | $20,650 | $57,633 |
| 2019 | $1,251 | $74,721 | $17,850 | $56,871 |
| 2018 | $1,194 | $69,197 | $14,700 | $54,497 |
| 2017 | $2,011 | $68,586 | $13,300 | $55,286 |
| 2016 | $1,118 | $57,349 | $9,450 | $47,899 |
| 2015 | $1,115 | $47,090 | $8,050 | $39,040 |
| 2014 | $1,083 | $38,346 | $7,000 | $31,346 |
Source: Public Records
Map
Nearby Homes
- 2234 Falling Rain Dr
- 6233 Apple Orchard Dr
- 6260 Peach Orchard Rd
- 6275 Allspice Ct
- 6311 American Beauty Ave
- 2316 Tulip Field St
- 2097 Audrey Hepburn St
- 6131 Pumpkin Patch Ave
- 6170 E Sahara Ave Unit 1031
- 6170 E Sahara Ave Unit 1076
- 6384 Cornstalk Cir
- 6080 Saint Petersburg Dr
- 6587 Candy Apple Cir
- 1779 Pineapple Tree Ct
- 2179 Raspberry Hill Rd
- 6092 Golden Nectar Way
- 6028 Las Nubes Dr
- 1927 Raspberry Hill Rd
- 6223 E Sahara Ave Unit 137
- 6223 E Sahara Ave Unit 165
- 6319 Berry Patch Way
- 6331 Berry Patch Way
- 6315 Berry Patch Way
- 6344 Peach Orchard Rd
- 6339 Berry Patch Way
- 6350 Peach Orchard Rd
- 6338 Peach Orchard Rd
- 6356 Peach Orchard Rd
- 6332 Peach Orchard Rd
- 6324 Berry Patch Way
- 6307 Berry Patch Way
- 6330 Berry Patch Way
- 6318 Berry Patch Way
- 6349 Berry Patch Way
- 6326 Peach Orchard Rd
- 6362 Peach Orchard Rd
- 6336 Berry Patch Way
- 6312 Berry Patch Way
- 6301 Berry Patch Way
- 6320 Peach Orchard Rd