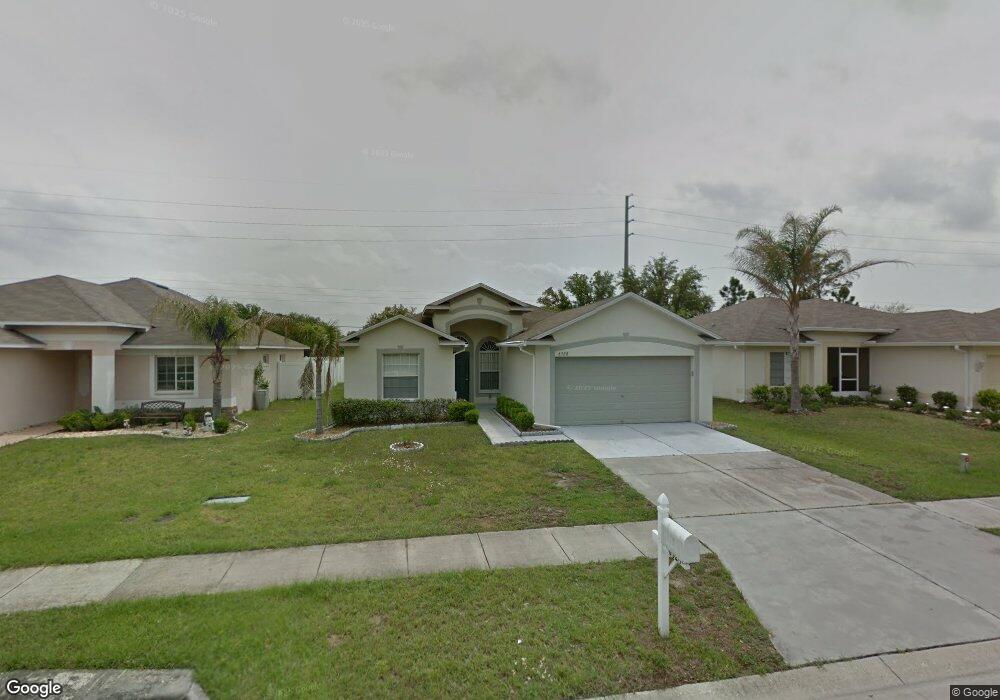
6328 Sushi Ct Wesley Chapel, FL 33545
Estimated Value: $347,000 - $366,980
3
Beds
2
Baths
1,948
Sq Ft
$182/Sq Ft
Est. Value
About This Home
This home is located at 6328 Sushi Ct, Wesley Chapel, FL 33545 and is currently estimated at $354,245, approximately $181 per square foot. 6328 Sushi Ct is a home located in Pasco County with nearby schools including Watergrass Elementary School, Thomas E. Weightman Middle School, and Wesley Chapel High School.
Ownership History
Date
Name
Owned For
Owner Type
Purchase Details
Closed on
Oct 19, 2020
Sold by
Williams William
Bought by
William And Hatsu M Williams Liv Tr
Current Estimated Value
Purchase Details
Closed on
Feb 18, 2011
Sold by
Federal Home Loan Mortgage Corporation
Bought by
Williams William and Williams Hatsu M
Purchase Details
Closed on
Jan 11, 2011
Sold by
Fifth Third Mortgage Company
Bought by
Federal Home Loan Mortgage Corp
Purchase Details
Closed on
Nov 9, 2010
Sold by
Viteri Becker A and Viteri Marina G
Bought by
Fifth Third Mortgage Company
Purchase Details
Closed on
May 28, 2004
Sold by
Us Home Corp
Bought by
Viteri Becker A
Home Financials for this Owner
Home Financials are based on the most recent Mortgage that was taken out on this home.
Original Mortgage
$142,100
Interest Rate
5.98%
Mortgage Type
Purchase Money Mortgage
Create a Home Valuation Report for This Property
The Home Valuation Report is an in-depth analysis detailing your home's value as well as a comparison with similar homes in the area
Home Values in the Area
Average Home Value in this Area
Purchase History
| Date | Buyer | Sale Price | Title Company |
|---|---|---|---|
| William And Hatsu M Williams Liv Tr | -- | Attorney | |
| Williams William | $115,000 | Buyers Title Inc | |
| Federal Home Loan Mortgage Corp | -- | Buyers Title Inc | |
| Fifth Third Mortgage Company | $72,500 | Attorney | |
| Viteri Becker A | $149,618 | North American Title Co |
Source: Public Records
Mortgage History
| Date | Status | Borrower | Loan Amount |
|---|---|---|---|
| Previous Owner | Viteri Becker A | $142,100 |
Source: Public Records
Tax History Compared to Growth
Tax History
| Year | Tax Paid | Tax Assessment Tax Assessment Total Assessment is a certain percentage of the fair market value that is determined by local assessors to be the total taxable value of land and additions on the property. | Land | Improvement |
|---|---|---|---|---|
| 2025 | $5,999 | $334,432 | $68,651 | $265,781 |
| 2024 | $5,999 | $342,143 | $63,010 | $279,133 |
| 2023 | $5,538 | $316,653 | $45,007 | $271,646 |
| 2022 | $1,181 | $104,980 | $0 | $0 |
| 2021 | $1,146 | $101,930 | $34,231 | $67,699 |
| 2020 | $1,120 | $100,530 | $27,258 | $73,272 |
| 2019 | $1,090 | $98,270 | $0 | $0 |
| 2018 | $1,061 | $96,442 | $0 | $0 |
| 2017 | $1,058 | $96,442 | $0 | $0 |
| 2016 | $1,000 | $92,515 | $0 | $0 |
| 2015 | $1,009 | $91,646 | $0 | $0 |
| 2014 | $976 | $127,848 | $22,503 | $105,345 |
Source: Public Records
Map
Nearby Homes
- 6325 Chapel Pines Blvd
- 32346 Sapna Chime Dr
- 31293 Hayman Loop
- 31288 Hayman Loop
- 31266 Hayman Loop
- Wagoner Plan at Riverston at Chapel Crossings - Chapel Crossings – Classic Series
- Sagan Plan at Riverston at Chapel Crossings - Chapel Crossings – Classic Series
- Colston Plan at Riverston at Chapel Crossings - Chapel Crossings – Classic Series
- Borrelli Plan at Riverston at Chapel Crossings - Chapel Crossings – Classic Series
- 31244 Hayman Loop
- 31227 Hayman Loop
- 5909 Riverston Ave
- 31215 Hayman Loop
- 31200 Hayman Loop
- 5883 Riverston Ave
- 31486 Hayman Loop
- 31537 Hayman Loop
- 31170 Hayman Loop
- 31173 Hayman Loop
- 31583 Hayman Loop