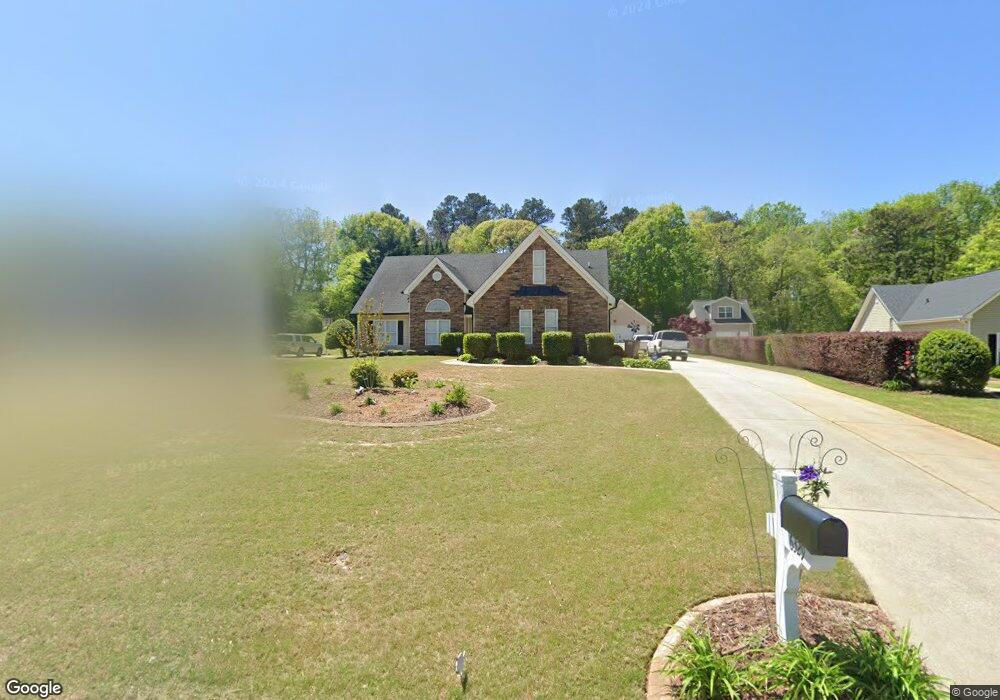
6329 Wilmington Way Flowery Branch, GA 30542
Estimated Value: $402,000 - $428,000
4
Beds
2
Baths
2,024
Sq Ft
$203/Sq Ft
Est. Value
About This Home
This home is located at 6329 Wilmington Way, Flowery Branch, GA 30542 and is currently estimated at $411,106, approximately $203 per square foot. 6329 Wilmington Way is a home located in Hall County with nearby schools including Friendship Elementary School, C.W. Davis Middle School, and Flowery Branch High School.
Ownership History
Date
Name
Owned For
Owner Type
Purchase Details
Closed on
Sep 21, 2009
Sold by
Frangi Ramone A and Frangi Kelly L
Bought by
Cole Ann H
Current Estimated Value
Purchase Details
Closed on
Jan 20, 2009
Sold by
Frangi Ramone A and Frangi Kelly L
Bought by
Cole Ann H
Home Financials for this Owner
Home Financials are based on the most recent Mortgage that was taken out on this home.
Original Mortgage
$113,000
Interest Rate
5.08%
Mortgage Type
New Conventional
Purchase Details
Closed on
Jun 30, 2000
Sold by
Northridge Homes Inc
Bought by
Frangi Ramon A
Home Financials for this Owner
Home Financials are based on the most recent Mortgage that was taken out on this home.
Original Mortgage
$125,900
Interest Rate
8.63%
Mortgage Type
New Conventional
Purchase Details
Closed on
May 3, 2000
Sold by
Cornerstone Equity Group Llc
Bought by
Northridge Homes Inc
Home Financials for this Owner
Home Financials are based on the most recent Mortgage that was taken out on this home.
Original Mortgage
$125,900
Interest Rate
8.63%
Mortgage Type
New Conventional
Create a Home Valuation Report for This Property
The Home Valuation Report is an in-depth analysis detailing your home's value as well as a comparison with similar homes in the area
Home Values in the Area
Average Home Value in this Area
Purchase History
| Date | Buyer | Sale Price | Title Company |
|---|---|---|---|
| Cole Ann H | -- | -- | |
| Cole Ann H | $193,000 | -- | |
| Frangi Ramon A | $139,900 | -- | |
| Northridge Homes Inc | $150,200 | -- |
Source: Public Records
Mortgage History
| Date | Status | Borrower | Loan Amount |
|---|---|---|---|
| Previous Owner | Cole Ann H | $113,000 | |
| Previous Owner | Frangi Ramon A | $125,900 |
Source: Public Records
Tax History Compared to Growth
Tax History
| Year | Tax Paid | Tax Assessment Tax Assessment Total Assessment is a certain percentage of the fair market value that is determined by local assessors to be the total taxable value of land and additions on the property. | Land | Improvement |
|---|---|---|---|---|
| 2024 | $1,356 | $153,584 | $26,480 | $127,104 |
| 2023 | $1,281 | $158,960 | $29,480 | $129,480 |
| 2022 | $1,223 | $127,440 | $32,480 | $94,960 |
| 2021 | $2,833 | $105,160 | $22,600 | $82,560 |
| 2020 | $2,698 | $97,080 | $16,040 | $81,040 |
| 2019 | $2,692 | $96,040 | $17,560 | $78,480 |
| 2018 | $2,313 | $79,520 | $11,040 | $68,480 |
| 2017 | $2,193 | $76,120 | $6,920 | $69,200 |
| 2016 | $2,071 | $73,520 | $6,920 | $66,600 |
| 2015 | $1,590 | $70,280 | $11,400 | $58,880 |
| 2014 | $1,590 | $67,230 | $11,400 | $55,830 |
Source: Public Records
Map
Nearby Homes
- 6325 Wilmington Way
- 6333 Wilmington Way
- 6337 Wilmington Way
- 6321 Wilmington Way Unit 2
- 6332 Wilmington Way
- 6341 Wilmington Way Unit 2
- 6316 Wilmington Way Unit 2
- 6345 Wilmington Way
- 6344 Wilmington Way
- 6317 Wilmington Way Unit 2
- 6298 Wilmington Way
- 6349 Wilmington Way
- 6313 Wilmington Way
- 6348 Wilmington Way
- 5015 Bennett Rd
- 6353 Wilmington Way Unit 2
- 6309 Wilmington Way
- 6290 Wilmington Way Unit 2
- 5051 Bennett Rd
- 6305 Wilmington Way