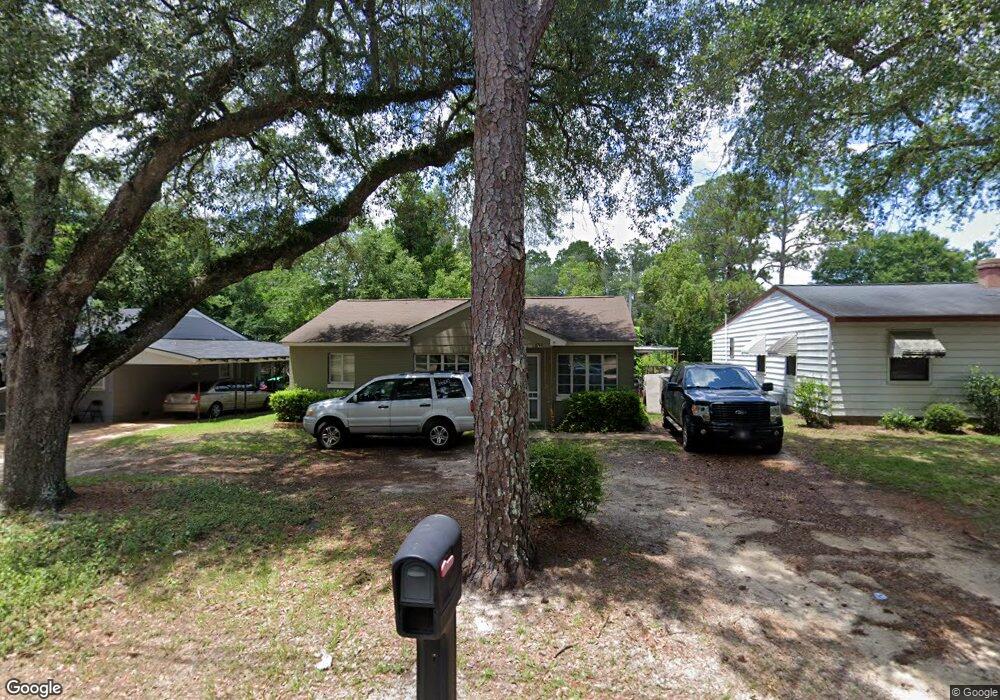
633 11th Ave Albany, GA 31701
Pecan Grove NeighborhoodEstimated Value: $72,000 - $81,000
3
Beds
1
Bath
1,407
Sq Ft
$53/Sq Ft
Est. Value
About This Home
This home is located at 633 11th Ave, Albany, GA 31701 and is currently estimated at $74,868, approximately $53 per square foot. 633 11th Ave is a home located in Dougherty County with nearby schools including Northside Elementary School, Albany Middle School, and Albany High School.
Ownership History
Date
Name
Owned For
Owner Type
Purchase Details
Closed on
Apr 28, 2009
Sold by
Peacock Faye H
Bought by
Peacock Faye H and Peacock Charles Keith
Current Estimated Value
Purchase Details
Closed on
Sep 17, 2008
Sold by
Peacock Charles K
Bought by
Peackoke Charles
Purchase Details
Closed on
Jan 27, 1998
Sold by
Peacock Charles G
Bought by
Peacock Charles G and Peacock Faye H
Purchase Details
Closed on
Jul 26, 1968
Sold by
Conley Donald J
Bought by
Peacock Charles G
Create a Home Valuation Report for This Property
The Home Valuation Report is an in-depth analysis detailing your home's value as well as a comparison with similar homes in the area
Home Values in the Area
Average Home Value in this Area
Purchase History
| Date | Buyer | Sale Price | Title Company |
|---|---|---|---|
| Peacock Faye H | -- | -- | |
| Peackoke Charles | -- | -- | |
| Peacock Charles G | -- | -- | |
| Peacock Charles G | -- | -- |
Source: Public Records
Tax History Compared to Growth
Tax History
| Year | Tax Paid | Tax Assessment Tax Assessment Total Assessment is a certain percentage of the fair market value that is determined by local assessors to be the total taxable value of land and additions on the property. | Land | Improvement |
|---|---|---|---|---|
| 2024 | $518 | $17,120 | $2,040 | $15,080 |
| 2023 | $0 | $17,120 | $2,040 | $15,080 |
| 2022 | $505 | $17,120 | $2,040 | $15,080 |
| 2021 | $460 | $17,120 | $2,040 | $15,080 |
| 2020 | $461 | $17,120 | $2,040 | $15,080 |
| 2019 | $462 | $17,120 | $2,040 | $15,080 |
| 2018 | $464 | $17,120 | $2,040 | $15,080 |
| 2017 | $425 | $17,120 | $2,040 | $15,080 |
| 2016 | $425 | $17,120 | $2,040 | $15,080 |
| 2015 | $426 | $17,120 | $2,040 | $15,080 |
| 2014 | $423 | $17,240 | $2,160 | $15,080 |
Source: Public Records
Map
Nearby Homes
- 634 11th Ave
- 703 9th Ave
- 1640 Arlington Park Cir
- 1648 Arlington Park Cir
- 723 10th Ave
- 1666 Arlington Park Cir
- 707 8th Ave
- 714 9th Ave
- 526 10th Ave
- 717 8th Ave
- 1739 Arlington Park Cir
- 800 7th Ave
- 900 10th Ave
- 903 9th Ave
- 820 7th Ave
- 822 7th Ave
- 1207 N Madison St
- 901 7th Ave
- 917 9th Ave
- 1107 N Davis St