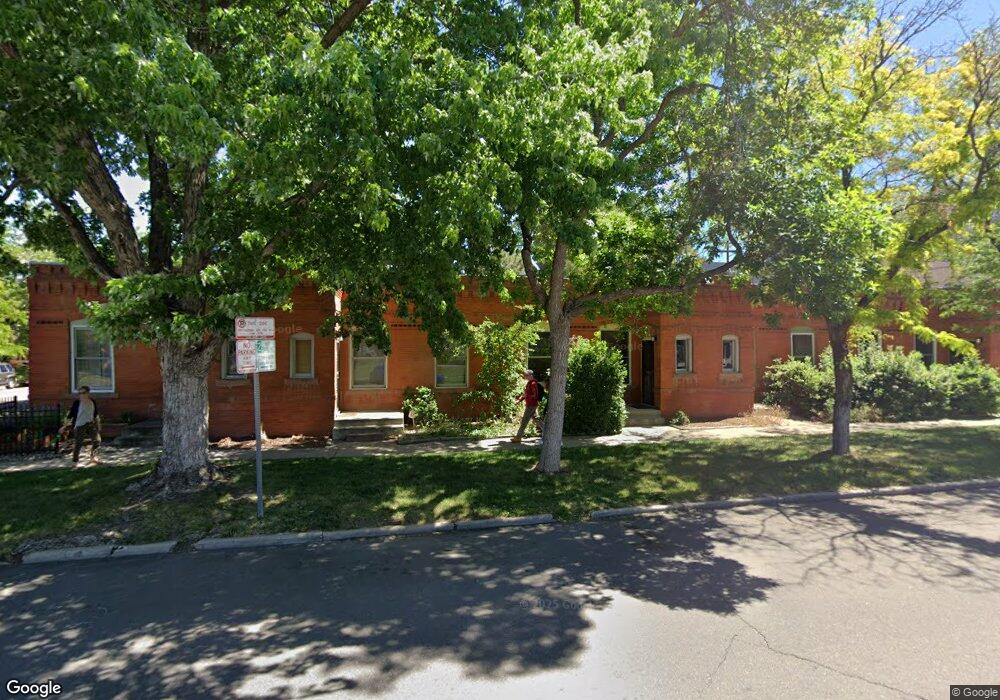
633 25th St Denver, CO 80205
Five Points NeighborhoodEstimated Value: $394,149 - $437,000
1
Bed
1
Bath
828
Sq Ft
$503/Sq Ft
Est. Value
About This Home
This home is located at 633 25th St, Denver, CO 80205 and is currently estimated at $416,287, approximately $502 per square foot. 633 25th St is a home located in Denver County with nearby schools including Whittier ECE-8 School, Cole Arts & Science Academy, and McAuliffe Manual Middle School.
Ownership History
Date
Name
Owned For
Owner Type
Purchase Details
Closed on
Sep 2, 2004
Sold by
Valdes Haydee
Bought by
Graham Stephan
Current Estimated Value
Home Financials for this Owner
Home Financials are based on the most recent Mortgage that was taken out on this home.
Original Mortgage
$145,000
Outstanding Balance
$69,380
Interest Rate
5.37%
Mortgage Type
Purchase Money Mortgage
Estimated Equity
$346,907
Purchase Details
Closed on
Jan 23, 2004
Sold by
Valera Harmon Myrarose
Bought by
Valdes Haydee
Purchase Details
Closed on
Feb 28, 2003
Sold by
Harmon Dale Andrew
Bought by
Valera Harmon Myrarose
Purchase Details
Closed on
Oct 26, 2000
Sold by
Smith Moreno Quibian and Salazar Moreno Quibian
Bought by
Harmon Dale A and Harmon Myrarose S
Purchase Details
Closed on
Aug 22, 1997
Sold by
Frago Irene K
Bought by
Smith Moreno Quibian
Home Financials for this Owner
Home Financials are based on the most recent Mortgage that was taken out on this home.
Original Mortgage
$64,466
Interest Rate
7.48%
Mortgage Type
FHA
Create a Home Valuation Report for This Property
The Home Valuation Report is an in-depth analysis detailing your home's value as well as a comparison with similar homes in the area
Home Values in the Area
Average Home Value in this Area
Purchase History
| Date | Buyer | Sale Price | Title Company |
|---|---|---|---|
| Graham Stephan | $155,000 | -- | |
| Valdes Haydee | -- | -- | |
| Valera Harmon Myrarose | -- | -- | |
| Harmon Dale A | $110,000 | North American Title Co | |
| Smith Moreno Quibian | $64,500 | -- |
Source: Public Records
Mortgage History
| Date | Status | Borrower | Loan Amount |
|---|---|---|---|
| Open | Graham Stephan | $145,000 | |
| Previous Owner | Smith Moreno Quibian | $64,466 |
Source: Public Records
Tax History Compared to Growth
Tax History
| Year | Tax Paid | Tax Assessment Tax Assessment Total Assessment is a certain percentage of the fair market value that is determined by local assessors to be the total taxable value of land and additions on the property. | Land | Improvement |
|---|---|---|---|---|
| 2024 | $2,247 | $28,370 | $2,390 | $25,980 |
| 2023 | $2,198 | $28,370 | $2,390 | $25,980 |
| 2022 | $2,076 | $26,100 | $7,480 | $18,620 |
| 2021 | $2,003 | $26,840 | $7,690 | $19,150 |
| 2020 | $1,772 | $23,880 | $5,670 | $18,210 |
| 2019 | $1,722 | $23,880 | $5,670 | $18,210 |
| 2018 | $1,543 | $19,950 | $4,890 | $15,060 |
| 2017 | $1,539 | $19,950 | $4,890 | $15,060 |
| 2016 | $1,279 | $15,680 | $3,606 | $12,074 |
| 2015 | $1,225 | $15,680 | $3,606 | $12,074 |
| 2014 | $924 | $11,130 | $2,364 | $8,766 |
Source: Public Records
Map
Nearby Homes
- 2623 Stout St
- 2423 Glenarm Place
- 2496 Champa St
- 709 27th St
- 2347 Glenarm Place Unit 2347
- 516 24th St Unit 516
- 2405 Tremont Place
- 2525 Arapahoe St Unit RD315
- 2256 Curtis St
- 2446 N Ogden St
- 2442 N Ogden St
- 2450 N Ogden St
- 3044 Champa St Unit 9 and NE 2/10
- 801 29th St Unit 817
- 2909 Glenarm Place
- 2350 N Ogden St
- 2707 N Downing St
- 2400 N Broadway Unit 4
- 1211 E 26th Ave
- 1038 29th St
- 631 25th St
- 637 25th St
- 625 25th St
- 2510 California St
- 623 25th St
- 2514 California St
- 2524 California St
- 2528 California St
- 2515 California St
- 2519 California St
- 2534 California St
- 2523 California St
- 2538 California St
- 2527 California St
- 2529 California St
- 2540 California St
- 716 25th St
- 2546 California St
- 2545 Welton St Unit B
- 2445 California St