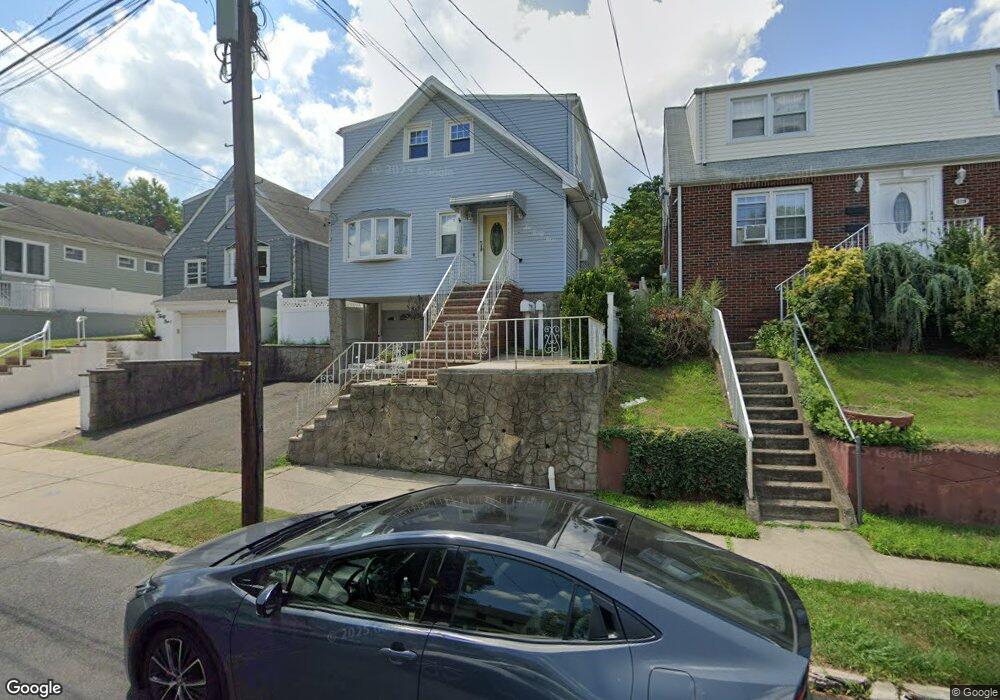
633 3rd St Unit 1 Lyndhurst, NJ 07071
Estimated Value: $625,096 - $725,000
2
Beds
1
Bath
1,574
Sq Ft
$431/Sq Ft
Est. Value
About This Home
This home is located at 633 3rd St Unit 1, Lyndhurst, NJ 07071 and is currently estimated at $678,774, approximately $431 per square foot. 633 3rd St Unit 1 is a home located in Bergen County with nearby schools including Lyndhurst High School and Sacred Heart School.
Ownership History
Date
Name
Owned For
Owner Type
Purchase Details
Closed on
Nov 21, 2011
Sold by
Cowan Thomas G and Cowan Marcia K
Bought by
Sein Robert J and Sein Kathryn M
Current Estimated Value
Home Financials for this Owner
Home Financials are based on the most recent Mortgage that was taken out on this home.
Original Mortgage
$315,000
Outstanding Balance
$213,238
Interest Rate
3.87%
Mortgage Type
Purchase Money Mortgage
Estimated Equity
$465,536
Purchase Details
Closed on
Aug 16, 1993
Sold by
Breslin Stella
Bought by
Cowan Thomas G
Create a Home Valuation Report for This Property
The Home Valuation Report is an in-depth analysis detailing your home's value as well as a comparison with similar homes in the area
Home Values in the Area
Average Home Value in this Area
Purchase History
| Date | Buyer | Sale Price | Title Company |
|---|---|---|---|
| Sein Robert J | $420,000 | -- | |
| Cowan Thomas G | $180,000 | -- |
Source: Public Records
Mortgage History
| Date | Status | Borrower | Loan Amount |
|---|---|---|---|
| Open | Sein Robert J | $315,000 |
Source: Public Records
Tax History
| Year | Tax Paid | Tax Assessment Tax Assessment Total Assessment is a certain percentage of the fair market value that is determined by local assessors to be the total taxable value of land and additions on the property. | Land | Improvement |
|---|---|---|---|---|
| 2025 | $10,939 | $531,300 | $308,200 | $223,100 |
| 2024 | $10,544 | $524,400 | $303,700 | $220,700 |
| 2023 | $9,110 | $518,900 | $300,700 | $218,200 |
| 2022 | $9,110 | $287,200 | $172,200 | $115,000 |
| 2021 | $8,731 | $287,200 | $172,200 | $115,000 |
| 2020 | $8,541 | $287,200 | $172,200 | $115,000 |
| 2019 | $8,478 | $287,200 | $172,200 | $115,000 |
| 2018 | $8,547 | $287,200 | $172,200 | $115,000 |
| 2017 | $8,332 | $287,200 | $172,200 | $115,000 |
| 2016 | $8,145 | $287,200 | $172,200 | $115,000 |
| 2015 | $7,889 | $287,200 | $172,200 | $115,000 |
| 2014 | $7,786 | $287,200 | $172,200 | $115,000 |
Source: Public Records
Map
Nearby Homes
- 734 Louise Ct
- 752 Ridge Rd
- 623 Schuyler Ave Unit 302
- 725 Schuyler Ave
- 471 Harding Ave
- 609 Chase Ave
- 612 Schuyler Ave
- 178 Leonard Place
- 184 Canterbury Ave
- 186 Canterbury Ave
- 188 Canterbury Ave
- 190 Canterbury Ave
- 192 Canterbury Ave
- 2 Eckhardt Terrace
- 194 Canterbury Ave
- 105 Jauncey Ave
- 433 Chase Ave
- 319 Ridge Rd
- 105 Jason Way
- 20 Bergen Ave
Your Personal Tour Guide
Ask me questions while you tour the home.