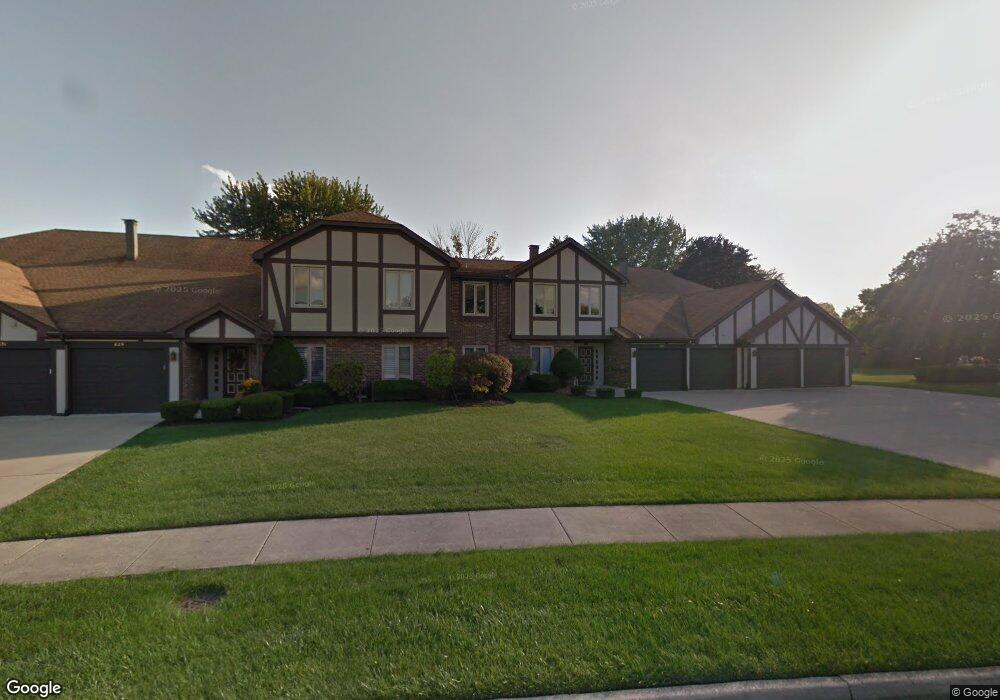
633 Big Timber Dr Unit 633 Joliet, IL 60431
Southwest Joliet NeighborhoodEstimated Value: $200,398 - $254,000
2
Beds
2
Baths
1,231
Sq Ft
$177/Sq Ft
Est. Value
About This Home
This home is located at 633 Big Timber Dr Unit 633, Joliet, IL 60431 and is currently estimated at $218,350, approximately $177 per square foot. 633 Big Timber Dr Unit 633 is a home located in Will County with nearby schools including Troy Craughwell Elementary School, Troy Middle School, and Orenic Intermediate School.
Ownership History
Date
Name
Owned For
Owner Type
Purchase Details
Closed on
Jun 5, 2017
Sold by
Hulina Richard and The Ffew James Hulina Revocabl
Bought by
Gutierrez Rick A
Current Estimated Value
Home Financials for this Owner
Home Financials are based on the most recent Mortgage that was taken out on this home.
Original Mortgage
$75,000
Outstanding Balance
$62,973
Interest Rate
4.37%
Mortgage Type
New Conventional
Estimated Equity
$155,377
Purchase Details
Closed on
Dec 3, 2014
Sold by
Hulina Andrew James
Bought by
Hulina Richard and Andrew James Hulina Revocable
Purchase Details
Closed on
Mar 11, 2001
Sold by
Berg Jean M and Jean M Berg Living Trust
Bought by
Hulina Andrew James
Purchase Details
Closed on
Nov 30, 1996
Sold by
Berg Jean M
Bought by
Berg Jean M and Jean M Berg Living Trust
Create a Home Valuation Report for This Property
The Home Valuation Report is an in-depth analysis detailing your home's value as well as a comparison with similar homes in the area
Home Values in the Area
Average Home Value in this Area
Purchase History
| Date | Buyer | Sale Price | Title Company |
|---|---|---|---|
| Gutierrez Rick A | $132,000 | Stewart Title | |
| Hulina Richard | -- | Attorney | |
| Hulina Andrew James | $125,000 | Ticor Title | |
| Berg Jean M | -- | -- |
Source: Public Records
Mortgage History
| Date | Status | Borrower | Loan Amount |
|---|---|---|---|
| Open | Gutierrez Rick A | $75,000 |
Source: Public Records
Tax History Compared to Growth
Tax History
| Year | Tax Paid | Tax Assessment Tax Assessment Total Assessment is a certain percentage of the fair market value that is determined by local assessors to be the total taxable value of land and additions on the property. | Land | Improvement |
|---|---|---|---|---|
| 2024 | $4,211 | $55,963 | $4,458 | $51,505 |
| 2023 | $4,211 | $50,281 | $4,005 | $46,276 |
| 2022 | $3,859 | $47,579 | $3,790 | $43,789 |
| 2021 | $3,602 | $44,759 | $3,565 | $41,194 |
| 2020 | $3,606 | $44,759 | $3,565 | $41,194 |
| 2019 | $3,487 | $42,935 | $3,420 | $39,515 |
| 2018 | $3,280 | $39,720 | $3,420 | $36,300 |
| 2017 | $3,240 | $37,670 | $3,420 | $34,250 |
| 2016 | $2,683 | $37,670 | $3,420 | $34,250 |
| 2015 | $2,752 | $37,670 | $3,420 | $34,250 |
| 2014 | $2,752 | $37,092 | $3,420 | $33,672 |
| 2013 | $2,752 | $39,045 | $3,420 | $35,625 |
Source: Public Records
Map
Nearby Homes
- 3016 Haven Ct
- 3011 Haven Ln
- Lot 48 Murphy Dr
- 410 Rollingwood Ln Unit 1
- 3509 Greenmeadow Ln Unit 1
- 260 Crabapple Dr
- 2858 Arden Place
- 1009 Murphy Dr
- 601 Fairlane Dr
- 206 Stephen Ln
- 725 Prestige St
- 3111 Ingalls Ave Unit 1B
- 712 Homestead Place
- 3107 Ingalls Ave Unit 1D
- 3107 Ingalls Ave Unit 3B
- 620 Tana Ln
- 901 Gael Dr Unit B
- 2604 Caddy Ln
- 701 Terry Dr
- 1014 Lindsay St
- 631 Big Timber Dr Unit 4D
- 639 Big Timber Dr Unit 3D
- 625 Big Timber Dr Unit 4A
- 633 Big Timber Dr Unit 3A
- 629 Big Timber Dr Unit 4C
- 635 Big Timber Dr Unit 3C
- 639 Big Timber Dr Unit D
- 627 Big Timber Dr Unit 4B
- 637 Big Timber Dr
- 607 Big Timber Dr
- 655 Big Timber Dr
- 605 Big Timber Dr
- 3211 Wild Oaks Ct
- 657 Big Timber Dr
- 603 Big Timber Dr
- 3221 Oakwood Dr
- 3225 Oakwood Dr
- 626 Big Timber Dr Unit D
- 628 Big Timber Dr
- 624 Big Timber Dr Unit 2