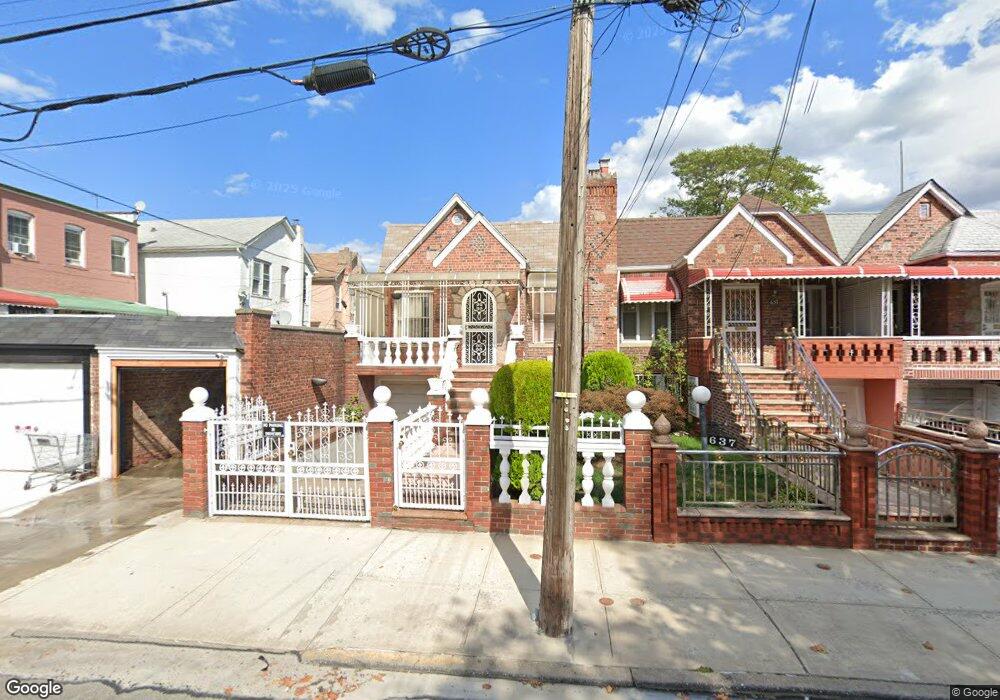
633 E 91st St Brooklyn, NY 11236
East Flatbush NeighborhoodEstimated Value: $761,056 - $819,000
4
Beds
2
Baths
1,809
Sq Ft
$437/Sq Ft
Est. Value
About This Home
This home is located at 633 E 91st St, Brooklyn, NY 11236 and is currently estimated at $790,014, approximately $436 per square foot. 633 E 91st St is a home located in Kings County with nearby schools including P.S. 233 The Langston Hughes School, I.S. 285 Meyer Levin, and New American Academy Charter School.
Ownership History
Date
Name
Owned For
Owner Type
Purchase Details
Closed on
Jul 28, 2000
Sold by
Stinvil Yvette
Bought by
Bazile Rubens and Stfelix Bazile Josiane
Current Estimated Value
Home Financials for this Owner
Home Financials are based on the most recent Mortgage that was taken out on this home.
Original Mortgage
$199,745
Interest Rate
8.07%
Mortgage Type
FHA
Create a Home Valuation Report for This Property
The Home Valuation Report is an in-depth analysis detailing your home's value as well as a comparison with similar homes in the area
Home Values in the Area
Average Home Value in this Area
Purchase History
| Date | Buyer | Sale Price | Title Company |
|---|---|---|---|
| Bazile Rubens | $201,500 | Stewart Title Insurance Co |
Source: Public Records
Mortgage History
| Date | Status | Borrower | Loan Amount |
|---|---|---|---|
| Previous Owner | Bazile Rubens | $199,745 |
Source: Public Records
Tax History
| Year | Tax Paid | Tax Assessment Tax Assessment Total Assessment is a certain percentage of the fair market value that is determined by local assessors to be the total taxable value of land and additions on the property. | Land | Improvement |
|---|---|---|---|---|
| 2025 | $5,935 | $46,440 | $13,980 | $32,460 |
| 2024 | $5,935 | $38,460 | $13,980 | $24,480 |
| 2023 | $6,001 | $46,920 | $13,980 | $32,940 |
| 2022 | $5,855 | $39,540 | $13,980 | $25,560 |
| 2021 | $5,823 | $43,380 | $13,980 | $29,400 |
| 2019 | $5,151 | $31,740 | $13,980 | $17,760 |
| 2018 | $5,020 | $24,624 | $9,824 | $14,800 |
| 2017 | $4,982 | $24,439 | $12,090 | $12,349 |
| 2016 | $4,609 | $23,056 | $12,760 | $10,296 |
| 2015 | $2,926 | $21,751 | $13,740 | $8,011 |
| 2014 | $2,926 | $20,520 | $15,540 | $4,980 |
Source: Public Records
Map
Nearby Homes
Your Personal Tour Guide
Ask me questions while you tour the home.