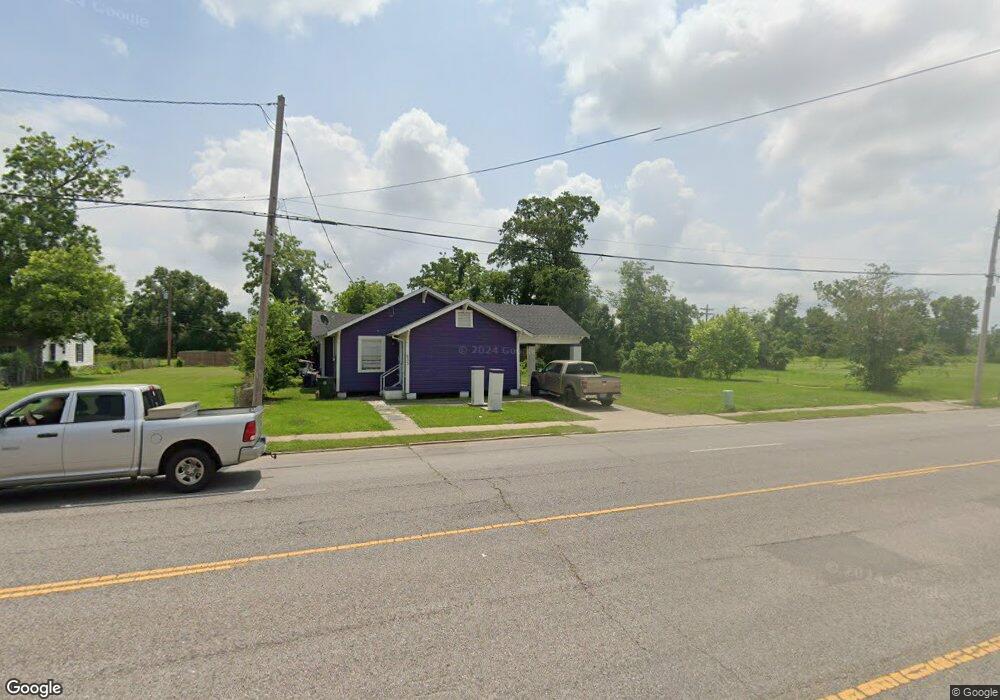
633 Enterprise Blvd Lake Charles, LA 70601
Estimated Value: $64,000 - $101,000
2
Beds
1
Bath
1,588
Sq Ft
$50/Sq Ft
Est. Value
About This Home
This home is located at 633 Enterprise Blvd, Lake Charles, LA 70601 and is currently estimated at $80,185, approximately $50 per square foot. 633 Enterprise Blvd is a home located in Calcasieu Parish with nearby schools including John J. Johnson II Elementary School, Ralph F. Wilson Elementary School, and Ray D. Molo Middle School.
Ownership History
Date
Name
Owned For
Owner Type
Purchase Details
Closed on
Jun 8, 2018
Sold by
Shade Tree Properties Llc
Bought by
Boardwalk Properties Llc
Current Estimated Value
Home Financials for this Owner
Home Financials are based on the most recent Mortgage that was taken out on this home.
Original Mortgage
$40,381
Outstanding Balance
$34,923
Interest Rate
4.5%
Mortgage Type
Commercial
Estimated Equity
$45,262
Purchase Details
Closed on
Apr 13, 2011
Sold by
Ducote Troy Joseph and Ducote Traci Christine
Bought by
Shade Tree Properties Llc
Purchase Details
Closed on
Jul 10, 2009
Sold by
Rado Bruce Eugene
Bought by
Ducote Troy Joseph and Ducote Traci Christine
Home Financials for this Owner
Home Financials are based on the most recent Mortgage that was taken out on this home.
Original Mortgage
$53,070
Interest Rate
4.97%
Mortgage Type
Seller Take Back
Create a Home Valuation Report for This Property
The Home Valuation Report is an in-depth analysis detailing your home's value as well as a comparison with similar homes in the area
Home Values in the Area
Average Home Value in this Area
Purchase History
| Date | Buyer | Sale Price | Title Company |
|---|---|---|---|
| Boardwalk Properties Llc | $48,000 | None Available | |
| Shade Tree Properties Llc | -- | None Available | |
| Ducote Troy Joseph | $61,000 | None Available |
Source: Public Records
Mortgage History
| Date | Status | Borrower | Loan Amount |
|---|---|---|---|
| Open | Boardwalk Properties Llc | $40,381 | |
| Previous Owner | Ducote Troy Joseph | $53,070 |
Source: Public Records
Tax History Compared to Growth
Tax History
| Year | Tax Paid | Tax Assessment Tax Assessment Total Assessment is a certain percentage of the fair market value that is determined by local assessors to be the total taxable value of land and additions on the property. | Land | Improvement |
|---|---|---|---|---|
| 2024 | $462 | $4,050 | $1,650 | $2,400 |
| 2023 | $462 | $4,050 | $1,650 | $2,400 |
| 2022 | $466 | $4,050 | $1,650 | $2,400 |
| 2021 | $447 | $4,050 | $1,650 | $2,400 |
| 2020 | $483 | $3,730 | $1,570 | $2,160 |
| 2019 | $525 | $3,900 | $1,500 | $2,400 |
| 2018 | $627 | $5,110 | $1,500 | $3,610 |
| 2017 | $580 | $5,110 | $1,500 | $3,610 |
| 2016 | $578 | $5,110 | $1,500 | $3,610 |
| 2015 | $578 | $5,110 | $1,500 | $3,610 |
Source: Public Records
Map
Nearby Homes
- 633 Enterprise Blvd
- 631 Enterprise Blvd
- 632 Boston Alley
- 625 Enterprise Blvd
- 637 Enterprise Blvd
- 628 Boston Alley
- 639 Enterprise Blvd
- 633 Boston Alley
- 621 Enterprise Blvd
- 634 Enterprise Blvd
- 630 Enterprise Blvd
- 619 Enterprise Blvd
- 2129 S Division St
- 620 Boston Alley
- 626 Enterprise Blvd
- 650 Boston Alley
- 642 Enterprise Blvd
- 634 S Franklin St
- 614 Benton Place
- 606 Benton