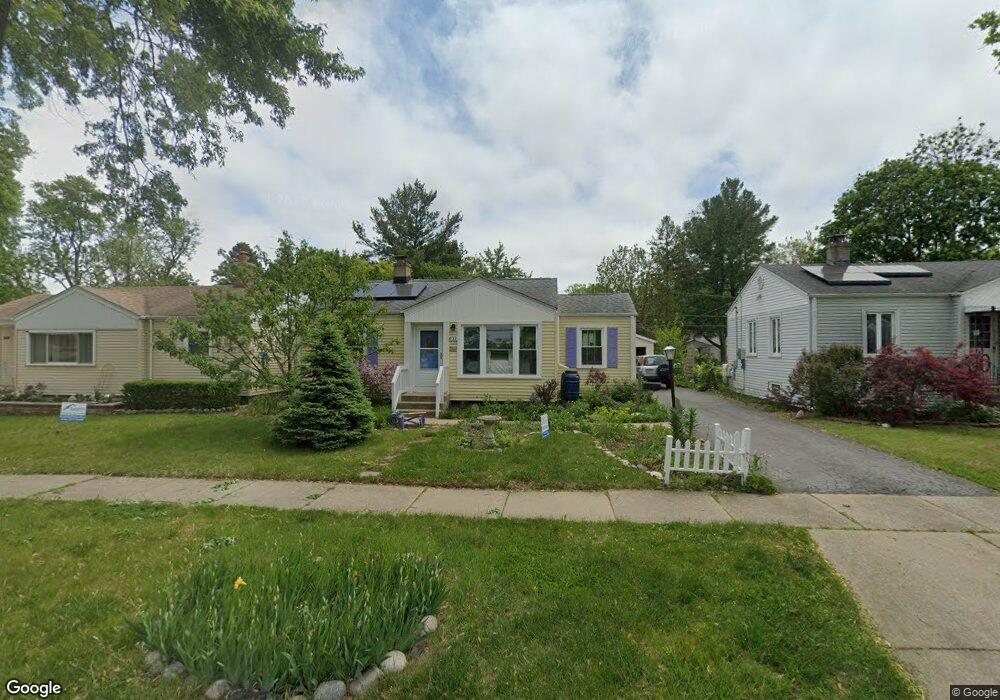
633 Greenview Ave Des Plaines, IL 60016
Estimated Value: $218,000 - $350,000
2
Beds
1
Bath
826
Sq Ft
$371/Sq Ft
Est. Value
About This Home
This home is located at 633 Greenview Ave, Des Plaines, IL 60016 and is currently estimated at $306,501, approximately $371 per square foot. 633 Greenview Ave is a home located in Cook County with nearby schools including Terrace Elementary School, Chippewa Middle School, and Maine West High School.
Ownership History
Date
Name
Owned For
Owner Type
Purchase Details
Closed on
Jun 21, 1999
Sold by
Cardona Thomas J and Cardona Holly
Bought by
Farmer Christopher J and Farmer Diana M
Current Estimated Value
Home Financials for this Owner
Home Financials are based on the most recent Mortgage that was taken out on this home.
Original Mortgage
$165,300
Outstanding Balance
$43,234
Interest Rate
7.69%
Estimated Equity
$263,267
Purchase Details
Closed on
Aug 30, 1995
Sold by
Nagy John A and Nagy Annessa D
Bought by
Cardona Thomas J and Cardona Holly
Home Financials for this Owner
Home Financials are based on the most recent Mortgage that was taken out on this home.
Original Mortgage
$122,400
Interest Rate
7.78%
Purchase Details
Closed on
Nov 15, 1994
Sold by
Quinnett Donald J and Thomas Sharon L
Bought by
Nagy John A and Nagy Annessa D
Home Financials for this Owner
Home Financials are based on the most recent Mortgage that was taken out on this home.
Original Mortgage
$90,000
Interest Rate
8.5%
Create a Home Valuation Report for This Property
The Home Valuation Report is an in-depth analysis detailing your home's value as well as a comparison with similar homes in the area
Home Values in the Area
Average Home Value in this Area
Purchase History
| Date | Buyer | Sale Price | Title Company |
|---|---|---|---|
| Farmer Christopher J | $174,000 | -- | |
| Cardona Thomas J | $136,000 | Attorneys Title Guaranty Fun | |
| Nagy John A | $136,000 | Attorneys Title Guaranty Fun |
Source: Public Records
Mortgage History
| Date | Status | Borrower | Loan Amount |
|---|---|---|---|
| Open | Farmer Christopher J | $165,300 | |
| Previous Owner | Cardona Thomas J | $122,400 | |
| Previous Owner | Nagy John A | $90,000 |
Source: Public Records
Tax History
| Year | Tax Paid | Tax Assessment Tax Assessment Total Assessment is a certain percentage of the fair market value that is determined by local assessors to be the total taxable value of land and additions on the property. | Land | Improvement |
|---|---|---|---|---|
| 2025 | $4,490 | $23,000 | $7,029 | $15,971 |
| 2024 | $4,490 | $23,001 | $5,858 | $17,143 |
| 2023 | $4,334 | $23,001 | $5,858 | $17,143 |
| 2022 | $4,334 | $23,001 | $5,858 | $17,143 |
| 2021 | $3,434 | $17,166 | $4,686 | $12,480 |
| 2020 | $3,500 | $17,166 | $4,686 | $12,480 |
| 2019 | $3,472 | $19,074 | $4,686 | $14,388 |
| 2018 | $3,231 | $16,986 | $4,100 | $12,886 |
| 2017 | $3,007 | $16,986 | $4,100 | $12,886 |
| 2016 | $4,073 | $18,937 | $4,100 | $14,837 |
| 2015 | $4,406 | $17,198 | $3,514 | $13,684 |
| 2014 | $4,329 | $17,198 | $3,514 | $13,684 |
| 2013 | $4,204 | $17,198 | $3,514 | $13,684 |
Source: Public Records
Map
Nearby Homes
- 652 E Prairie Ave
- 556 Orchard Ct
- 508 Crestwood Dr
- 584 S 4th Ave
- 886 E Thacker St
- 373 Woodbridge St
- 980 W Grant Dr
- 503 La Salle St
- 890 North Ave
- 321 Woodbridge St
- 1005 Woodlawn Ave
- 1122 Alfini Dr
- 1107 E Prairie Ave
- 681 S Mount Prospect Rd
- 1162 W Grant Dr
- 674 E Algonquin Rd
- 1205 S Wolf Rd
- 1048 E Walnut Ave
- 390 S Western Ave Unit 706
- 887 Ingram Place
- 641 Greenview Ave
- 629 Greenview Ave
- 643 Greenview Ave
- 617 Greenview Ave
- 640 E Prairie Ave
- 632 E Prairie Ave
- 645 Greenview Ave
- 644 E Prairie Ave
- 624 E Prairie Ave
- 605 Greenview Ave
- 652 S 6th Ave
- 660 S 6th Ave
- 644 S 6th Ave
- 668 S 6th Ave
- 640 S 6th Ave
- 653 Greenview Ave
- 662 E Prairie Ave
- 604 E Prairie Ave
- 630 Greenview Ave
- 665 Greenview Ave
Your Personal Tour Guide
Ask me questions while you tour the home.