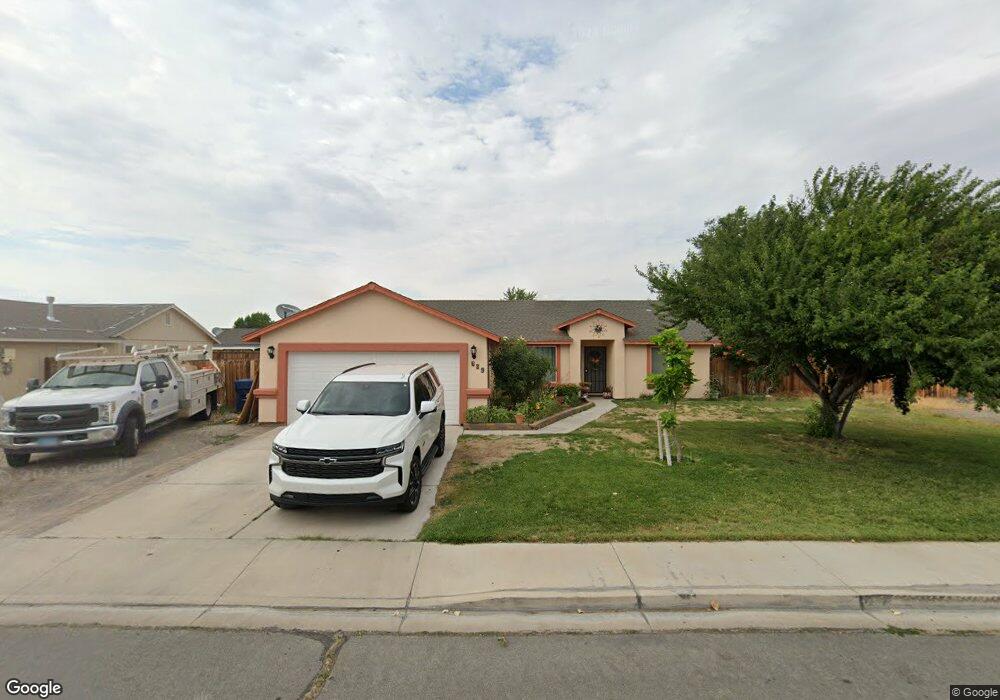
633 Jennys Ln Fernley, NV 89408
Estimated Value: $344,000 - $382,000
3
Beds
2
Baths
1,475
Sq Ft
$245/Sq Ft
Est. Value
About This Home
This home is located at 633 Jennys Ln, Fernley, NV 89408 and is currently estimated at $361,568, approximately $245 per square foot. 633 Jennys Ln is a home located in Lyon County with nearby schools including Cottonwood Elementary School, Fernley Intermediate School, and Fernley High School.
Ownership History
Date
Name
Owned For
Owner Type
Purchase Details
Closed on
Feb 15, 2011
Sold by
Secretary Of Veterans Affairs
Bought by
Rodarte Maria E
Current Estimated Value
Home Financials for this Owner
Home Financials are based on the most recent Mortgage that was taken out on this home.
Original Mortgage
$81,772
Outstanding Balance
$55,875
Interest Rate
4.75%
Mortgage Type
FHA
Estimated Equity
$305,693
Purchase Details
Closed on
Sep 29, 2010
Sold by
Midfirst Bank
Bought by
Secretary Of Veterans Affairs
Purchase Details
Closed on
Sep 27, 2010
Sold by
Gibson W David and Gibson Stephanie
Bought by
Midfirst Bank
Purchase Details
Closed on
Apr 28, 2005
Sold by
Duncan Jesse R and Duncan Amber D
Bought by
Gibson W David and Gibson Stephanie
Home Financials for this Owner
Home Financials are based on the most recent Mortgage that was taken out on this home.
Original Mortgage
$229,325
Interest Rate
5.62%
Mortgage Type
Adjustable Rate Mortgage/ARM
Create a Home Valuation Report for This Property
The Home Valuation Report is an in-depth analysis detailing your home's value as well as a comparison with similar homes in the area
Home Values in the Area
Average Home Value in this Area
Purchase History
| Date | Buyer | Sale Price | Title Company |
|---|---|---|---|
| Rodarte Maria E | $83,900 | Western Title Company | |
| Secretary Of Veterans Affairs | $255,180 | Lsi Title Company | |
| Midfirst Bank | $88,130 | Accommodation | |
| Gibson W David | $224,500 | Title Service & Escrow Co |
Source: Public Records
Mortgage History
| Date | Status | Borrower | Loan Amount |
|---|---|---|---|
| Open | Rodarte Maria E | $81,772 | |
| Previous Owner | Gibson W David | $229,325 |
Source: Public Records
Tax History Compared to Growth
Tax History
| Year | Tax Paid | Tax Assessment Tax Assessment Total Assessment is a certain percentage of the fair market value that is determined by local assessors to be the total taxable value of land and additions on the property. | Land | Improvement |
|---|---|---|---|---|
| 2025 | $1,365 | $103,692 | $49,000 | $54,692 |
| 2024 | $1,735 | $104,125 | $49,000 | $55,125 |
| 2023 | $1,735 | $100,680 | $49,000 | $51,680 |
| 2022 | $1,635 | $96,768 | $49,000 | $47,768 |
| 2021 | $1,624 | $79,951 | $33,250 | $46,701 |
| 2020 | $1,584 | $79,001 | $33,250 | $45,751 |
| 2019 | $1,566 | $70,380 | $26,250 | $44,130 |
| 2018 | $1,536 | $60,654 | $17,500 | $43,154 |
| 2017 | $1,536 | $55,789 | $12,600 | $43,189 |
| 2016 | $1,352 | $46,049 | $6,300 | $39,749 |
| 2015 | $1,388 | $29,482 | $6,300 | $23,182 |
| 2014 | $1,358 | $26,796 | $6,300 | $20,496 |
Source: Public Records
Map
Nearby Homes
- 1224 Mountain Rose Dr
- 698 Jenny's Ln
- 1411 Shadow Ln
- 1494 Mountain Rose Dr
- 1165 Farm Ln
- 1505 Wrangler Ln
- 2605 Emerson Cir
- 675 Warren Way
- 636 Brook Ln
- 870 Jennys Ln
- 1405 Buckboard Way
- 863 Jennys Ln
- 1525 Wrangler Ln
- 465 Jennys Ln
- 955 Aster Ln
- 1240-1250 Farm District Rd
- 965 Aster Ln
- 350 Randon Ct
- 1165 Jenny's Ln
- 736 Shadow Ln
- 629 Jennys Ln
- 637 Jennys Ln
- 515 Darren Way Unit ROLLING MEADOWS SUBD
- 515 Darren Way
- 513 Darren Way
- 517 Darren Way
- 625 Jennys Ln
- 641 Jennys Ln
- 519 Darren Way
- 511 Darren Way
- 636 Jennys Ln
- 632 Jennys Ln
- 628 Jenny's Ln
- 640 Jennys Ln
- 628 Jennys Ln
- 645 Jennys Ln
- 619 Jennys Ln
- 644 Jennys Ln
- 514 Darren Way
- 624 Jennys Ln