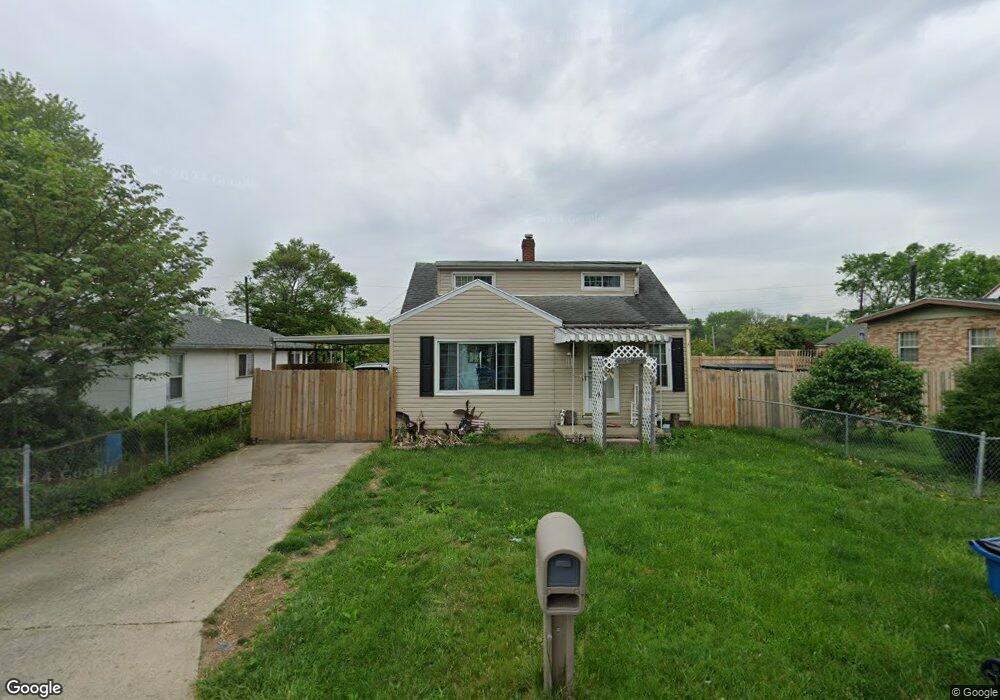
633 Lorella Ave Dayton, OH 45404
Avondale NeighborhoodEstimated Value: $130,000 - $146,000
3
Beds
1
Bath
1,224
Sq Ft
$114/Sq Ft
Est. Value
About This Home
This home is located at 633 Lorella Ave, Dayton, OH 45404 and is currently estimated at $139,442, approximately $113 per square foot. 633 Lorella Ave is a home located in Montgomery County with nearby schools including Stebbins High School, Pathway School of Discovery, and Horizon Science Academy Dayton Downtown.
Ownership History
Date
Name
Owned For
Owner Type
Purchase Details
Closed on
Nov 15, 2018
Sold by
Olinger Devin Dean and Olinger Stacey
Bought by
Cyphers Roberta J
Current Estimated Value
Home Financials for this Owner
Home Financials are based on the most recent Mortgage that was taken out on this home.
Original Mortgage
$74,205
Outstanding Balance
$65,248
Interest Rate
4.8%
Mortgage Type
New Conventional
Estimated Equity
$74,194
Purchase Details
Closed on
Mar 2, 2009
Sold by
Blake Billie Jo and Blake Billy Jo
Bought by
Olinger Devin Dean
Home Financials for this Owner
Home Financials are based on the most recent Mortgage that was taken out on this home.
Original Mortgage
$64,804
Interest Rate
5.14%
Mortgage Type
FHA
Purchase Details
Closed on
Feb 21, 2007
Sold by
Blake Billie Jo
Bought by
Blake Billie Jo and Blake Richard
Create a Home Valuation Report for This Property
The Home Valuation Report is an in-depth analysis detailing your home's value as well as a comparison with similar homes in the area
Home Values in the Area
Average Home Value in this Area
Purchase History
| Date | Buyer | Sale Price | Title Company |
|---|---|---|---|
| Cyphers Roberta J | $76,500 | Landmark Title Agency South | |
| Olinger Devin Dean | $66,000 | Attorney | |
| Blake Billie Jo | -- | Attorney |
Source: Public Records
Mortgage History
| Date | Status | Borrower | Loan Amount |
|---|---|---|---|
| Open | Cyphers Roberta J | $74,205 | |
| Previous Owner | Olinger Devin Dean | $64,804 |
Source: Public Records
Tax History Compared to Growth
Tax History
| Year | Tax Paid | Tax Assessment Tax Assessment Total Assessment is a certain percentage of the fair market value that is determined by local assessors to be the total taxable value of land and additions on the property. | Land | Improvement |
|---|---|---|---|---|
| 2024 | $1,548 | $32,160 | $4,210 | $27,950 |
| 2023 | $1,548 | $32,160 | $4,210 | $27,950 |
| 2022 | $1,654 | $25,740 | $3,370 | $22,370 |
| 2021 | $1,685 | $25,740 | $3,370 | $22,370 |
| 2020 | $1,685 | $25,740 | $3,370 | $22,370 |
| 2019 | $1,685 | $22,970 | $3,030 | $19,940 |
| 2018 | $1,688 | $22,970 | $3,030 | $19,940 |
| 2017 | $1,688 | $22,970 | $3,030 | $19,940 |
| 2016 | $1,719 | $22,710 | $3,370 | $19,340 |
| 2015 | $1,847 | $22,710 | $3,370 | $19,340 |
| 2014 | $1,847 | $22,710 | $3,370 | $19,340 |
| 2012 | -- | $20,660 | $3,360 | $17,300 |
Source: Public Records
Map
Nearby Homes
- 641 Prince Albert Blvd
- 241 Community Dr
- 518 Tyron Ave
- - Prince Albert Blvd
- -- Prince Albert Blvd
- 546 Wynora Ave
- 1930 Brandt Pike
- 34 Ingleside Ave
- - Rondowa Ave
- -- Rondowa Ave
- 3586 Lane Garden Ct
- 2460 Bushnell Ave
- 2249 Prince Albert Blvd
- 2249 Valley Pike
- 2245 Valley Pike
- -- Valley Pike
- - Valley Pike
- 2249 - Valley Pike
- 2301 Valley Pike
- 29 Barcelona Ave
- 641 Lorella Ave
- 629 Lorella Ave
- 625 Lorella Ave
- 621 Lorella Ave
- 636 Lorella Ave
- 645 Lorella Ave
- 630 Lorella Ave
- 640 Lorella Ave
- 624 Lorella Ave
- 620 Lorella Ave
- 609 Lorella Ave
- 616 Lorella Ave
- 1025 N Pleasant Valley Ave
- 605 Lorella Ave
- 635 Prince Albert Blvd
- 637 Prince Albert Blvd
- 601 Lorella Ave
- 625 Prince Albert Blvd
- 608 Lorella Ave
- 639 Prince Albert Blvd