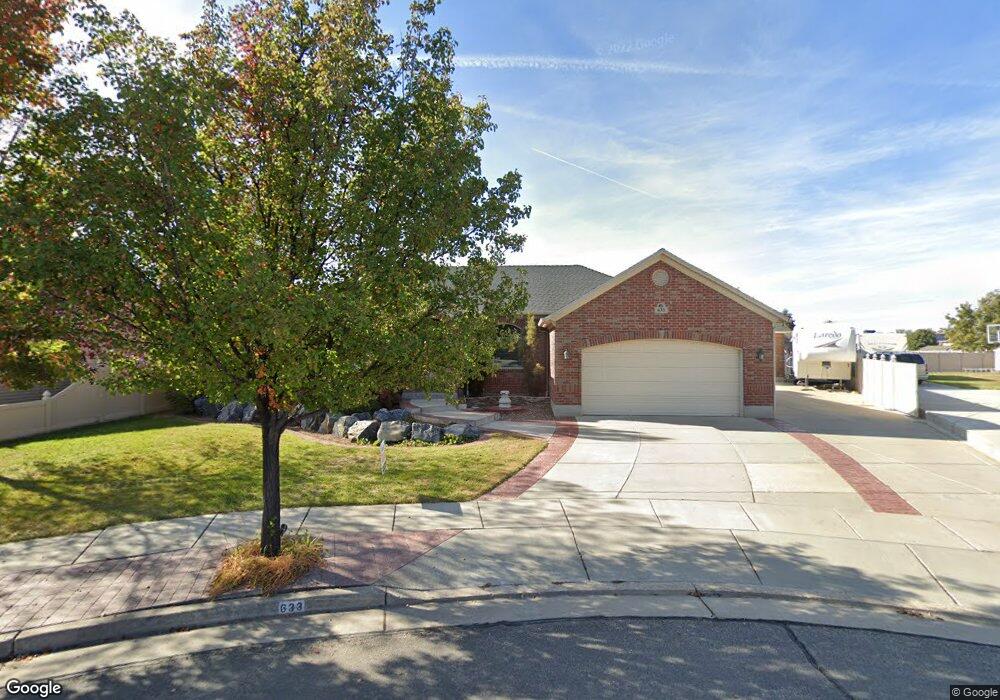
633 N 2050 W Clearfield, UT 84015
Estimated Value: $612,000 - $696,000
5
Beds
4
Baths
3,676
Sq Ft
$181/Sq Ft
Est. Value
About This Home
This home is located at 633 N 2050 W, Clearfield, UT 84015 and is currently estimated at $664,250, approximately $180 per square foot. 633 N 2050 W is a home located in Davis County with nearby schools including Lakeside School, West Point Junior High School, and Syracuse High School.
Ownership History
Date
Name
Owned For
Owner Type
Purchase Details
Closed on
Apr 25, 2022
Sold by
Price Living Trust
Bought by
Schultz Neil and Schultz Debra
Current Estimated Value
Home Financials for this Owner
Home Financials are based on the most recent Mortgage that was taken out on this home.
Original Mortgage
$420,721
Outstanding Balance
$398,584
Interest Rate
5.11%
Mortgage Type
New Conventional
Estimated Equity
$265,666
Purchase Details
Closed on
Sep 30, 2019
Sold by
Price Gary D and Price Katherine
Bought by
Price Gary D and Price Kathleen
Home Financials for this Owner
Home Financials are based on the most recent Mortgage that was taken out on this home.
Original Mortgage
$221,000
Interest Rate
3.5%
Mortgage Type
New Conventional
Purchase Details
Closed on
Mar 15, 2018
Sold by
Price Gary D and Price Kathleen
Bought by
Price Gary D and Price Living Trust
Purchase Details
Closed on
Feb 26, 2003
Sold by
Thurgood Edna J and Thurgood Vern L
Bought by
Price Gary D and Price Kathleen
Create a Home Valuation Report for This Property
The Home Valuation Report is an in-depth analysis detailing your home's value as well as a comparison with similar homes in the area
Home Values in the Area
Average Home Value in this Area
Purchase History
| Date | Buyer | Sale Price | Title Company |
|---|---|---|---|
| Schultz Neil | -- | Old Republic Title | |
| Price Gary D | -- | Mountain View Title | |
| Price Gary D | -- | Mountain View Title | |
| Price Gary D | -- | -- | |
| Price Gary D | -- | Bonneville Title Company Inc |
Source: Public Records
Mortgage History
| Date | Status | Borrower | Loan Amount |
|---|---|---|---|
| Open | Schultz Neil | $420,721 | |
| Previous Owner | Price Gary D | $221,000 |
Source: Public Records
Tax History Compared to Growth
Tax History
| Year | Tax Paid | Tax Assessment Tax Assessment Total Assessment is a certain percentage of the fair market value that is determined by local assessors to be the total taxable value of land and additions on the property. | Land | Improvement |
|---|---|---|---|---|
| 2025 | $3,463 | $324,500 | $119,792 | $204,708 |
| 2024 | $3,331 | $313,500 | $107,841 | $205,659 |
| 2023 | $3,263 | $565,000 | $134,796 | $430,204 |
| 2022 | $3,540 | $335,500 | $70,221 | $265,279 |
| 2021 | $664 | $454,000 | $109,313 | $344,687 |
| 2020 | $2,823 | $395,000 | $91,906 | $303,094 |
| 2019 | $2,740 | $378,000 | $89,145 | $288,855 |
| 2018 | $2,530 | $344,000 | $88,985 | $255,015 |
| 2016 | $216 | $157,795 | $34,438 | $123,357 |
| 2015 | $2,215 | $150,150 | $34,438 | $115,712 |
| 2014 | $145 | $137,438 | $34,438 | $103,000 |
| 2013 | -- | $134,645 | $39,443 | $95,202 |
Source: Public Records
Map
Nearby Homes
- 607 N 2000 W
- 2132 W 800 N
- 2283 W 470 N
- 1805 W 675 N
- 1832 W 725 N
- 1827 W 775 N
- 2348 W 800 N
- 1774 W 400 N
- 1652 W 560 N
- 2535 W 550 N
- 878 N 2600 W
- 12 N 2000 W Unit 1
- 47 N 1750 W
- 575 N 1350 W Unit 137
- 1350 W 300 N Unit 49
- 1350 W 300 N Unit 38
- 1350 W 300 N Unit 29
- 563 N 1350 W Unit 139
- 2371 W 1300 N
- 1317 N 1850 W