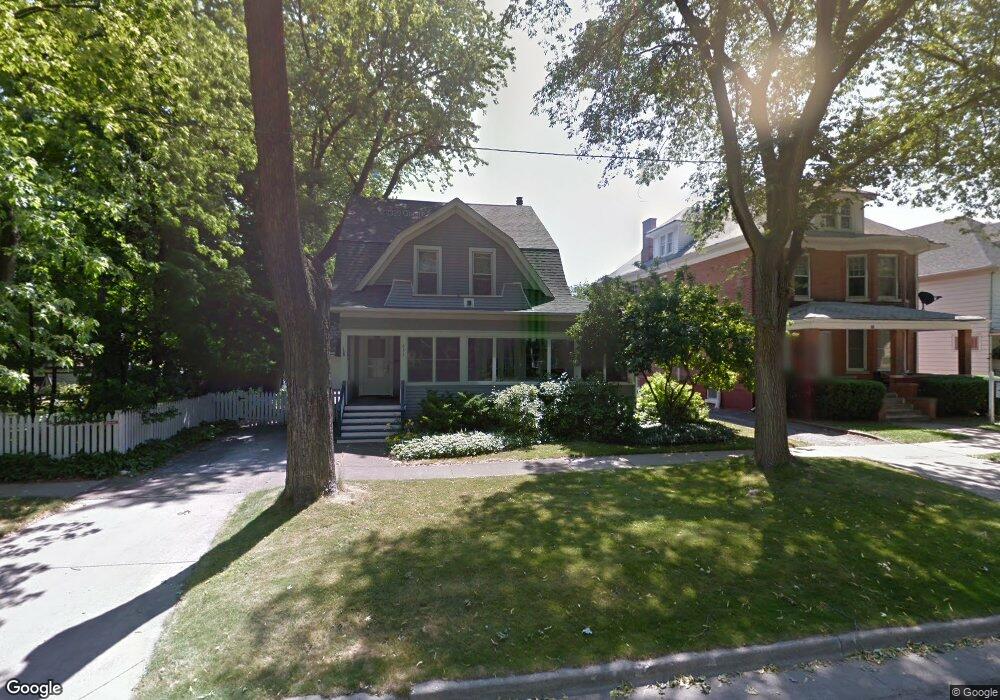
633 N Genesee St Waukegan, IL 60085
Estimated Value: $261,000 - $314,000
4
Beds
3
Baths
2,284
Sq Ft
$128/Sq Ft
Est. Value
About This Home
This home is located at 633 N Genesee St, Waukegan, IL 60085 and is currently estimated at $292,513, approximately $128 per square foot. 633 N Genesee St is a home located in Lake County with nearby schools including Edith M Smith Middle School, Waukegan High School, and Most Blessed Trinity Academy.
Create a Home Valuation Report for This Property
The Home Valuation Report is an in-depth analysis detailing your home's value as well as a comparison with similar homes in the area
Home Values in the Area
Average Home Value in this Area
Tax History Compared to Growth
Tax History
| Year | Tax Paid | Tax Assessment Tax Assessment Total Assessment is a certain percentage of the fair market value that is determined by local assessors to be the total taxable value of land and additions on the property. | Land | Improvement |
|---|---|---|---|---|
| 2024 | $5,905 | $87,243 | $8,525 | $78,718 |
| 2023 | $5,984 | $78,625 | $7,633 | $70,992 |
| 2022 | $5,984 | $72,209 | $7,260 | $64,949 |
| 2021 | $5,337 | $62,194 | $6,476 | $55,718 |
| 2020 | $5,321 | $57,941 | $6,033 | $51,908 |
| 2019 | $5,259 | $53,093 | $5,528 | $47,565 |
| 2018 | $4,554 | $46,925 | $7,042 | $39,883 |
| 2017 | $4,341 | $41,515 | $6,230 | $35,285 |
| 2016 | $3,875 | $36,075 | $5,414 | $30,661 |
| 2015 | $4,441 | $32,288 | $4,846 | $27,442 |
| 2014 | $4,561 | $32,493 | $4,447 | $28,046 |
| 2012 | $5,872 | $35,204 | $4,819 | $30,385 |
Source: Public Records
Map
Nearby Homes
- 723 N County St
- 611 N Genesee St
- 325 4th St
- 415 W Ridgeland Ave
- 452 North Ave
- 222 Grand Ave
- 918 N Ash St
- 620 N Poplar St
- 702 Franklin St
- 522 N Poplar St
- 428 N Poplar St
- 511 Chestnut St
- 1110 N Ash St
- 1122 N Ash St
- 917 N Linden Ave
- 1336 N Ash St
- 1335 Chestnut St
- 1109 Massena Ave
- 28 N Saint James St
- 1105 Woodlawn Cir
- 629 N Genesee St
- 625 N Genesee St
- 634 N Sheridan Rd
- 628 N Sheridan Rd
- 702 N Sheridan Rd
- 709 N Genesee St
- 624 N Sheridan Rd
- 710 N Sheridan Rd
- 628 N Genesee St
- 613 N Genesee St
- 638 N Genesee St
- 624 N Genesee St
- 616 N Sheridan Rd
- 719 N Genesee St
- 620 N Genesee St
- 710 N Genesee St
- 610 N Sheridan Rd
- 610 N Sheridan Rd Unit 1
- 703 N Sheridan Rd
- 635 N Sheridan Rd