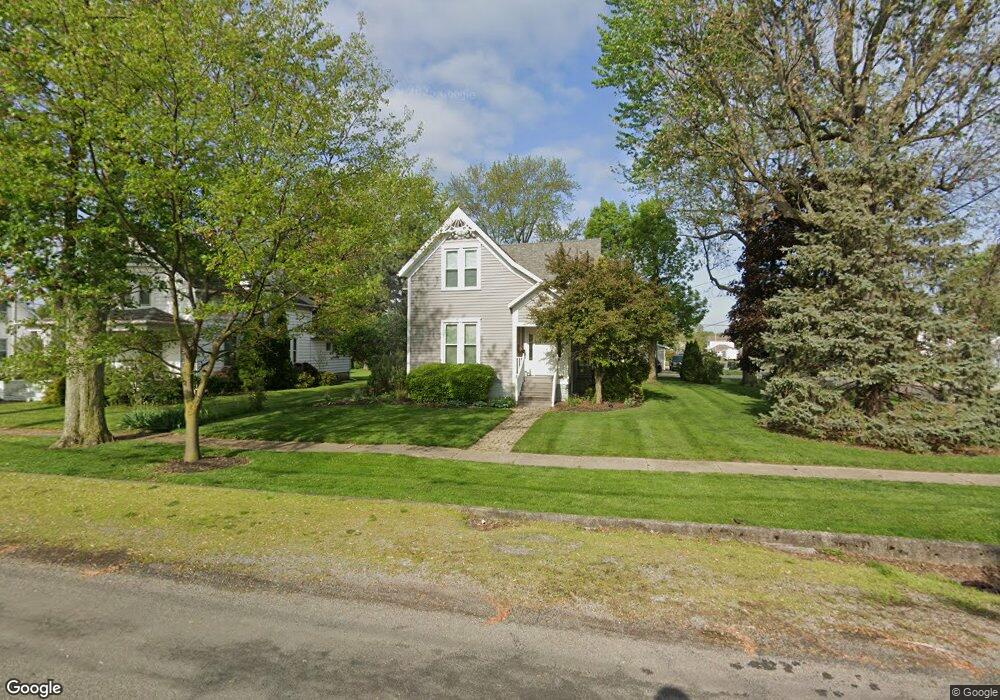
633 N Pierce St Delphos, OH 45833
Estimated Value: $161,000 - $238,000
3
Beds
2
Baths
2,132
Sq Ft
$88/Sq Ft
Est. Value
About This Home
This home is located at 633 N Pierce St, Delphos, OH 45833 and is currently estimated at $188,368, approximately $88 per square foot. 633 N Pierce St is a home located in Allen County with nearby schools including Delphos St. John's High School and Delphos St. John's Elementary School.
Ownership History
Date
Name
Owned For
Owner Type
Purchase Details
Closed on
Dec 28, 2015
Sold by
Buzard Kim M and Buzard Mary Ann
Bought by
Linderman Kelly
Current Estimated Value
Home Financials for this Owner
Home Financials are based on the most recent Mortgage that was taken out on this home.
Original Mortgage
$124,643
Outstanding Balance
$100,061
Interest Rate
4.25%
Mortgage Type
FHA
Estimated Equity
$88,307
Purchase Details
Closed on
Sep 27, 1985
Bought by
Buzard Kim M and Mary Ann
Create a Home Valuation Report for This Property
The Home Valuation Report is an in-depth analysis detailing your home's value as well as a comparison with similar homes in the area
Home Values in the Area
Average Home Value in this Area
Purchase History
| Date | Buyer | Sale Price | Title Company |
|---|---|---|---|
| Linderman Kelly | $127,000 | None Available | |
| Buzard Kim M | $31,000 | -- |
Source: Public Records
Mortgage History
| Date | Status | Borrower | Loan Amount |
|---|---|---|---|
| Open | Linderman Kelly | $124,643 |
Source: Public Records
Tax History Compared to Growth
Tax History
| Year | Tax Paid | Tax Assessment Tax Assessment Total Assessment is a certain percentage of the fair market value that is determined by local assessors to be the total taxable value of land and additions on the property. | Land | Improvement |
|---|---|---|---|---|
| 2024 | $1,537 | $48,450 | $7,180 | $41,270 |
| 2023 | $1,211 | $36,160 | $5,360 | $30,800 |
| 2022 | $1,241 | $36,160 | $5,360 | $30,800 |
| 2021 | $1,248 | $36,160 | $5,360 | $30,800 |
| 2020 | $994 | $30,210 | $5,110 | $25,100 |
| 2019 | $994 | $30,210 | $5,110 | $25,100 |
| 2018 | $979 | $30,210 | $5,110 | $25,100 |
| 2017 | $935 | $27,930 | $5,110 | $22,820 |
| 2016 | $924 | $27,930 | $5,110 | $22,820 |
| 2015 | $912 | $27,930 | $5,110 | $22,820 |
| 2014 | $826 | $24,990 | $4,900 | $20,090 |
| 2013 | $831 | $24,990 | $4,900 | $20,090 |
Source: Public Records
Map
Nearby Homes
- 628 N Pierce St
- 704 N Franklin St
- 610 N Washington St
- 810 N Franklin St
- 405 N Franklin St
- 210 E 3rd St
- 650 E 6th St
- 821 E 3rd St
- 633 E 2nd St
- 903 E 3rd St
- 914 E 3rd St
- 503 W 6th St
- 604 W 6th St
- 409 N Bredeick St
- 616 W 5th St
- 221 S Main St
- 1303 Carolyn Dr
- 1220 Rose Anna Dr
- 424 S Canal St
- 508 S Washington St