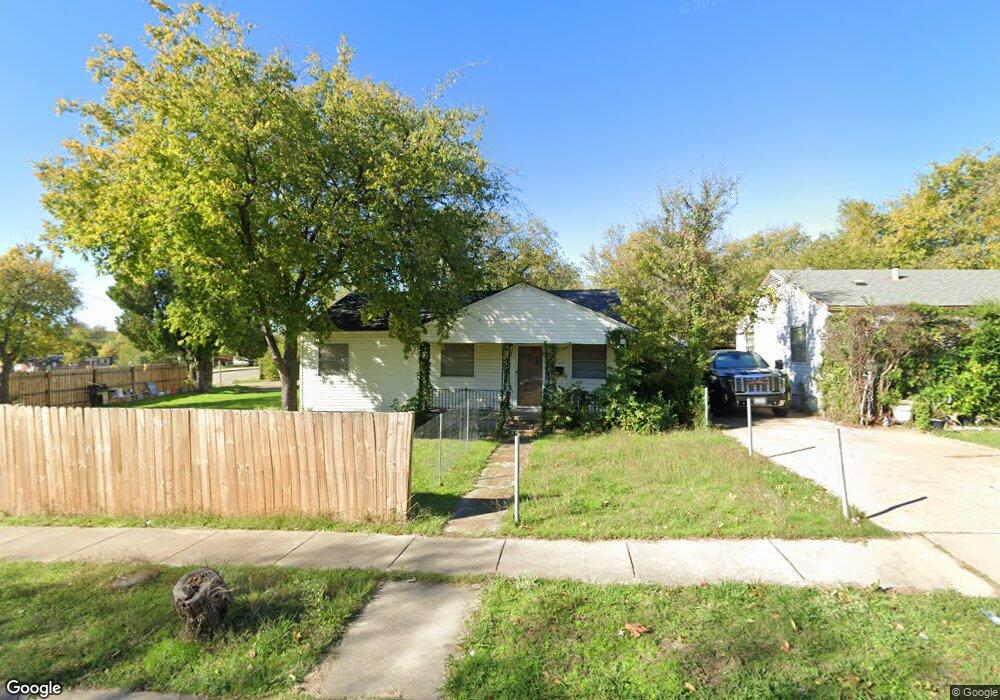
633 Ouida St Grand Prairie, TX 75051
Estimated Value: $279,600 - $294,000
4
Beds
2
Baths
1,632
Sq Ft
$175/Sq Ft
Est. Value
About This Home
This home is located at 633 Ouida St, Grand Prairie, TX 75051 and is currently estimated at $284,900, approximately $174 per square foot. 633 Ouida St is a home located in Dallas County with nearby schools including James Bowie Fine Arts Academy, Crosswinds High School, and Young Men's Leadership Academy at Kennedy Middle School.
Ownership History
Date
Name
Owned For
Owner Type
Purchase Details
Closed on
Aug 26, 2014
Sold by
Hilburn Jeff and Hilburn Jennifer
Bought by
Morales Briones Jose Antonio and Vivara Montano Genoveva
Current Estimated Value
Home Financials for this Owner
Home Financials are based on the most recent Mortgage that was taken out on this home.
Original Mortgage
$80,550
Outstanding Balance
$71,109
Interest Rate
9.3%
Mortgage Type
Adjustable Rate Mortgage/ARM
Estimated Equity
$213,791
Purchase Details
Closed on
Dec 1, 2003
Sold by
Hall Joe Emerson
Bought by
Hilburn Jeff and Hilburn Jennifer
Home Financials for this Owner
Home Financials are based on the most recent Mortgage that was taken out on this home.
Original Mortgage
$53,600
Interest Rate
5.94%
Mortgage Type
Purchase Money Mortgage
Create a Home Valuation Report for This Property
The Home Valuation Report is an in-depth analysis detailing your home's value as well as a comparison with similar homes in the area
Home Values in the Area
Average Home Value in this Area
Purchase History
| Date | Buyer | Sale Price | Title Company |
|---|---|---|---|
| Morales Briones Jose Antonio | -- | None Available | |
| Hilburn Jeff | -- | -- |
Source: Public Records
Mortgage History
| Date | Status | Borrower | Loan Amount |
|---|---|---|---|
| Open | Morales Briones Jose Antonio | $80,550 | |
| Previous Owner | Hilburn Jeff | $53,600 | |
| Closed | Hilburn Jeff | $10,000 |
Source: Public Records
Tax History Compared to Growth
Tax History
| Year | Tax Paid | Tax Assessment Tax Assessment Total Assessment is a certain percentage of the fair market value that is determined by local assessors to be the total taxable value of land and additions on the property. | Land | Improvement |
|---|---|---|---|---|
| 2025 | $5,865 | $260,580 | $45,000 | $215,580 |
| 2024 | $5,865 | $260,580 | $45,000 | $215,580 |
| 2023 | $5,865 | $275,920 | $45,000 | $230,920 |
| 2022 | $5,364 | $211,450 | $40,000 | $171,450 |
| 2021 | $4,411 | $165,980 | $35,000 | $130,980 |
| 2020 | $4,532 | $160,720 | $35,000 | $125,720 |
| 2019 | $4,123 | $141,110 | $28,000 | $113,110 |
| 2018 | $2,971 | $101,680 | $20,000 | $81,680 |
| 2017 | $3,076 | $105,360 | $20,000 | $85,360 |
| 2016 | $2,623 | $89,850 | $17,000 | $72,850 |
| 2015 | $1,366 | $90,690 | $17,000 | $73,690 |
| 2014 | $1,366 | $60,730 | $17,000 | $43,730 |
Source: Public Records
Map
Nearby Homes