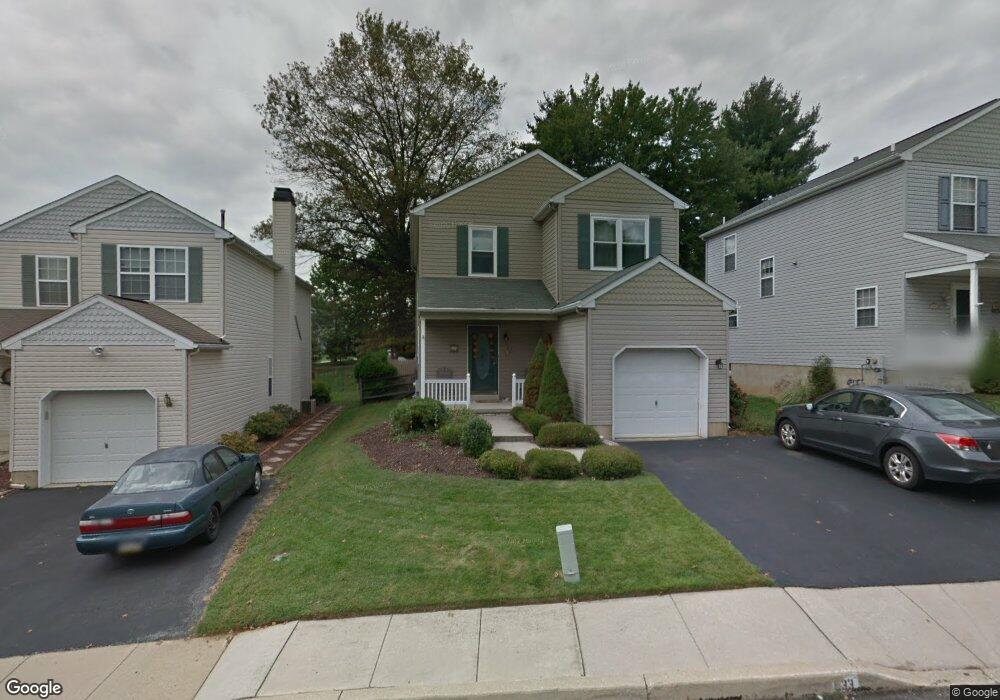
633 Picket Way West Chester, PA 19382
Estimated Value: $520,000 - $577,000
3
Beds
3
Baths
1,600
Sq Ft
$341/Sq Ft
Est. Value
About This Home
This home is located at 633 Picket Way, West Chester, PA 19382 and is currently estimated at $545,054, approximately $340 per square foot. 633 Picket Way is a home located in Chester County with nearby schools including Westtown-Thornbury Elementary School, Stetson Middle School, and Bayard Rustin High School.
Ownership History
Date
Name
Owned For
Owner Type
Purchase Details
Closed on
Feb 26, 2010
Sold by
Noone Carol M and Noone Martin D
Bought by
Cesca James A and Cesca Jessica A
Current Estimated Value
Home Financials for this Owner
Home Financials are based on the most recent Mortgage that was taken out on this home.
Original Mortgage
$240,000
Outstanding Balance
$159,226
Interest Rate
5%
Mortgage Type
New Conventional
Estimated Equity
$385,828
Purchase Details
Closed on
Sep 7, 2001
Sold by
Jones Martin C and Dixon Jones Sarah L
Bought by
Noone Carol M and Noone Martin D
Purchase Details
Closed on
Sep 5, 1996
Sold by
Wild Goose Farms Inc
Bought by
Jones Martin C and Dixon Jones Sarah L
Home Financials for this Owner
Home Financials are based on the most recent Mortgage that was taken out on this home.
Original Mortgage
$145,350
Interest Rate
7.5%
Create a Home Valuation Report for This Property
The Home Valuation Report is an in-depth analysis detailing your home's value as well as a comparison with similar homes in the area
Home Values in the Area
Average Home Value in this Area
Purchase History
| Date | Buyer | Sale Price | Title Company |
|---|---|---|---|
| Cesca James A | $300,000 | None Available | |
| Noone Carol M | $217,000 | -- | |
| Jones Martin C | $161,510 | -- |
Source: Public Records
Mortgage History
| Date | Status | Borrower | Loan Amount |
|---|---|---|---|
| Open | Cesca James A | $240,000 | |
| Previous Owner | Jones Martin C | $145,350 |
Source: Public Records
Tax History Compared to Growth
Tax History
| Year | Tax Paid | Tax Assessment Tax Assessment Total Assessment is a certain percentage of the fair market value that is determined by local assessors to be the total taxable value of land and additions on the property. | Land | Improvement |
|---|---|---|---|---|
| 2025 | $4,670 | $151,100 | $53,700 | $97,400 |
| 2024 | $4,670 | $151,100 | $53,700 | $97,400 |
| 2023 | $4,638 | $151,100 | $53,700 | $97,400 |
| 2022 | $4,550 | $151,100 | $53,700 | $97,400 |
| 2021 | $4,490 | $151,100 | $53,700 | $97,400 |
| 2020 | $4,462 | $151,100 | $53,700 | $97,400 |
| 2019 | $4,403 | $151,100 | $53,700 | $97,400 |
| 2018 | $4,314 | $151,100 | $53,700 | $97,400 |
| 2017 | $4,226 | $151,100 | $53,700 | $97,400 |
| 2016 | $3,234 | $151,100 | $53,700 | $97,400 |
| 2015 | $3,234 | $151,100 | $53,700 | $97,400 |
| 2014 | $3,234 | $151,100 | $53,700 | $97,400 |
Source: Public Records
Map
Nearby Homes