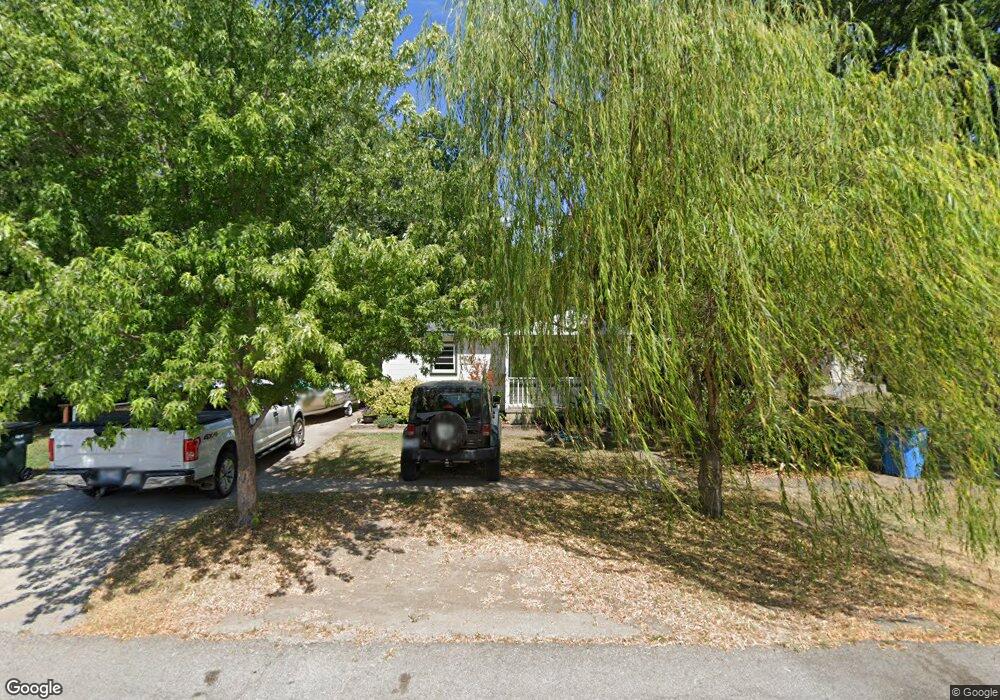
633 S Javine St Skiatook, OK 74070
Estimated Value: $118,229 - $169,000
2
Beds
2
Baths
1,068
Sq Ft
$135/Sq Ft
Est. Value
About This Home
This home is located at 633 S Javine St, Skiatook, OK 74070 and is currently estimated at $144,057, approximately $134 per square foot. 633 S Javine St is a home with nearby schools including Marrs Elementary School, Newman Middle School, and Skiatook High School.
Ownership History
Date
Name
Owned For
Owner Type
Purchase Details
Closed on
Apr 29, 2009
Sold by
Williamson Chuck L and Williamson Christy
Bought by
Pillers Christopher J and Pillers India D
Current Estimated Value
Home Financials for this Owner
Home Financials are based on the most recent Mortgage that was taken out on this home.
Original Mortgage
$86,734
Outstanding Balance
$54,858
Interest Rate
5.03%
Mortgage Type
New Conventional
Estimated Equity
$89,199
Purchase Details
Closed on
Oct 28, 2002
Sold by
Freeman Jerald C Family Rev
Bought by
Williamson Chuck L and Williamson
Purchase Details
Closed on
Oct 10, 2002
Sold by
Bacon Francis H and Mary Jean
Bought by
Freeman Jerald C Family Rev
Purchase Details
Closed on
Dec 15, 2000
Sold by
Freeman Jerald C Family Rev
Bought by
Bacon Francis H and Mary Jean
Purchase Details
Closed on
Jul 26, 1994
Sold by
Freeman Jerald C Etal
Bought by
Freeman Jerald C Family Rev
Create a Home Valuation Report for This Property
The Home Valuation Report is an in-depth analysis detailing your home's value as well as a comparison with similar homes in the area
Home Values in the Area
Average Home Value in this Area
Purchase History
| Date | Buyer | Sale Price | Title Company |
|---|---|---|---|
| Pillers Christopher J | $85,000 | -- | |
| Williamson Chuck L | $20,000 | -- | |
| Freeman Jerald C Family Rev | -- | -- | |
| Bacon Francis H | $59,500 | -- | |
| Freeman Jerald C Family Rev | -- | -- |
Source: Public Records
Mortgage History
| Date | Status | Borrower | Loan Amount |
|---|---|---|---|
| Open | Pillers Christopher J | $86,734 |
Source: Public Records
Tax History Compared to Growth
Tax History
| Year | Tax Paid | Tax Assessment Tax Assessment Total Assessment is a certain percentage of the fair market value that is determined by local assessors to be the total taxable value of land and additions on the property. | Land | Improvement |
|---|---|---|---|---|
| 2025 | $1,103 | $11,086 | $1,172 | $9,914 |
| 2024 | $1,054 | $10,558 | $600 | $9,958 |
| 2023 | $1,054 | $10,558 | $600 | $9,958 |
| 2022 | $1,046 | $10,558 | $600 | $9,958 |
| 2021 | $1,049 | $10,558 | $600 | $9,958 |
| 2020 | $1,056 | $10,558 | $600 | $9,958 |
| 2019 | $1,069 | $10,558 | $600 | $9,958 |
| 2018 | $1,064 | $10,558 | $600 | $9,958 |
| 2017 | $1,080 | $10,558 | $600 | $9,958 |
| 2016 | $1,056 | $10,282 | $600 | $9,682 |
| 2015 | $1,048 | $10,282 | $600 | $9,682 |
| 2014 | $996 | $10,282 | $600 | $9,682 |
| 2013 | $996 | $10,282 | $600 | $9,682 |
Source: Public Records
Map
Nearby Homes
- 534 S Osage St
- 615 S Haynie St
- 001 4th St
- 002 4th St
- 0 E Maple St
- 724 S Haynie St
- 209 W 3rd St
- 305 E Elm St
- 106 S A St Unit 11
- 106 S A St Unit 3
- 1001 County Road 2265
- 312 E Elm St
- 411 Pine Ave
- 14 W Chestnut St
- 101 E 1st St
- 133 W Chestnut Place
- 715 W 4th St
- 1122 S Russell St
- 116 W Dogwood St
- 1127 S Russell St
- 635 S Javine St
- 507 S Javine St
- 634 S Javine St
- 540 S Osage St
- 614 S Javine St
- 534 S Osage Ave
- 501 S Javine St
- 610 S Javine St
- 610 S Javine St
- 712 S Javine St
- 423 S Javine St
- 209 W Maple St
- 532 S Osage St
- 419 S Javine St
- 602 S Javine St
- 530 S Osage St
- 525 S Haynie St
- 517 S Haynie St
- 708 S Javine St
- 224 W Maple St