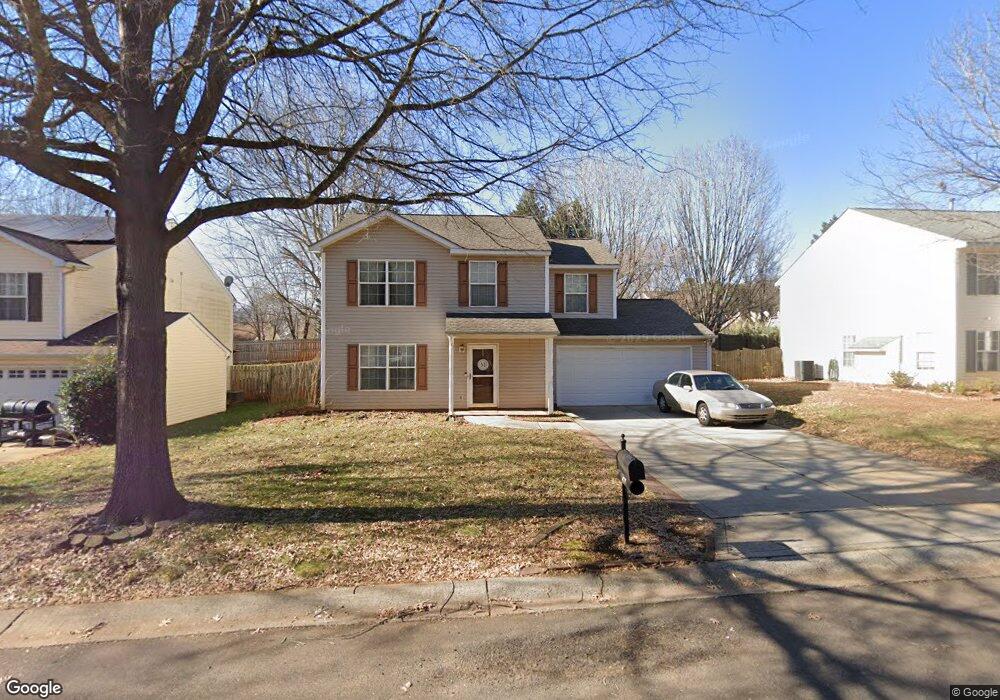
633 Saratoga Dr Clover, SC 29710
Estimated Value: $305,000 - $335,000
Studio
1
Bath
1,544
Sq Ft
$207/Sq Ft
Est. Value
About This Home
This home is located at 633 Saratoga Dr, Clover, SC 29710 and is currently estimated at $319,408, approximately $206 per square foot. 633 Saratoga Dr is a home with nearby schools including Crowders Creek Elementary School, Oakridge Middle School, and Clover High School.
Ownership History
Date
Name
Owned For
Owner Type
Purchase Details
Closed on
Aug 31, 2016
Sold by
Garris Charles D and Garris Robin A
Bought by
Milbry Adrean L
Current Estimated Value
Home Financials for this Owner
Home Financials are based on the most recent Mortgage that was taken out on this home.
Original Mortgage
$147,200
Outstanding Balance
$119,681
Interest Rate
4.25%
Mortgage Type
Adjustable Rate Mortgage/ARM
Estimated Equity
$199,727
Purchase Details
Closed on
Jan 31, 2008
Sold by
Marcelli James M and Marcelli Sheri A
Bought by
Garris Charles D and Garris Robin A
Home Financials for this Owner
Home Financials are based on the most recent Mortgage that was taken out on this home.
Original Mortgage
$140,000
Interest Rate
6.06%
Mortgage Type
New Conventional
Purchase Details
Closed on
Feb 14, 2001
Sold by
Crossmann Communities Of Nc Inc
Bought by
Marcelli James M and Bridges Sheri A
Create a Home Valuation Report for This Property
The Home Valuation Report is an in-depth analysis detailing your home's value as well as a comparison with similar homes in the area
Home Values in the Area
Average Home Value in this Area
Purchase History
We collect this data history from publicly available records. To have your information removed, we recommend requesting removal directly through your county’s website.
| Date | Buyer | Sale Price | Title Company |
|---|---|---|---|
| Milbry Adrean L | $160,000 | None Available | |
| Garris Charles D | $140,000 | None Available | |
| Marcelli James M | $128,085 | -- |
Source: Public Records
Mortgage History
We collect this data history from publicly available records. To have your information removed, we recommend requesting removal directly through your county’s website.
| Date | Status | Borrower | Loan Amount |
|---|---|---|---|
| Open | Milbry Adrean L | $147,200 | |
| Previous Owner | Garris Charles D | $140,000 |
Source: Public Records
Tax History
| Year | Tax Paid | Tax Assessment Tax Assessment Total Assessment is a certain percentage of the fair market value that is determined by local assessors to be the total taxable value of land and additions on the property. | Land | Improvement |
|---|---|---|---|---|
| 2025 | $1,094 | $7,988 | $1,883 | $6,105 |
| 2024 | $981 | $6,946 | $1,793 | $5,153 |
| 2023 | $1,006 | $6,946 | $1,793 | $5,153 |
| 2022 | $829 | $6,946 | $1,793 | $5,153 |
| 2021 | -- | $6,946 | $1,793 | $5,153 |
| 2020 | $786 | $6,946 | $0 | $0 |
| 2019 | $746 | $6,040 | $0 | $0 |
| 2018 | $750 | $6,040 | $0 | $0 |
| 2017 | $698 | $6,040 | $0 | $0 |
| 2016 | $512 | $7,050 | $0 | $0 |
| 2014 | $588 | $7,050 | $1,800 | $5,250 |
| 2013 | $588 | $7,740 | $1,800 | $5,940 |
Source: Public Records
Map
Nearby Homes
- 2086 Shady Pond Dr
- 2095 Shady Pond Dr
- 1264 Winding Path Rd
- 2099 Shady Pond Dr
- 980 Autumn Glen Ct
- 1434 Swaying Branch Ln
- 2126 Shady Pond Dr
- 2027 Shady Pond Dr Unit 174
- 973 Autumn Glen Ct
- 2013 Campfire Trail
- 949 Autumn Glen Ct
- 36 Timberidge Dr
- 8 Hickory Ridge Ct
- 2 Honeysuckle Woods
- 126 Misty Woods Dr
- 473 Evergreen Rd
- 138 Misty Woods Dr
- 64 Timberidge Dr
- 537 Channel Rd
- 31 Fairway Ridge
- 634 Saratoga Dr
- 408 Oak Crest Dr
- 1092 Valley Forge Dr
- 626 Saratoga Dr
- 1096 Valley Forge Dr
- 637 Saratoga Dr
- 629 Saratoga Dr
- 236 Autumn Leaf Ln
- 409 Oak Crest Dr
- 641 Saratoga Dr Unit 110
- 210 Autumn Leaf Ln
- 622 Saratoga Dr
- 625 Saratoga Dr
- 407 Oak Crest Dr
- 407 Oak Crest Dr Unit 121
- 836 Settlement Dr
- 618 Saratoga Dr
- 200 Autumn Leaf Ln
- 832 Settlement Dr
- 621 Saratoga Dr Unit 93
Your Personal Tour Guide
Ask me questions while you tour the home.