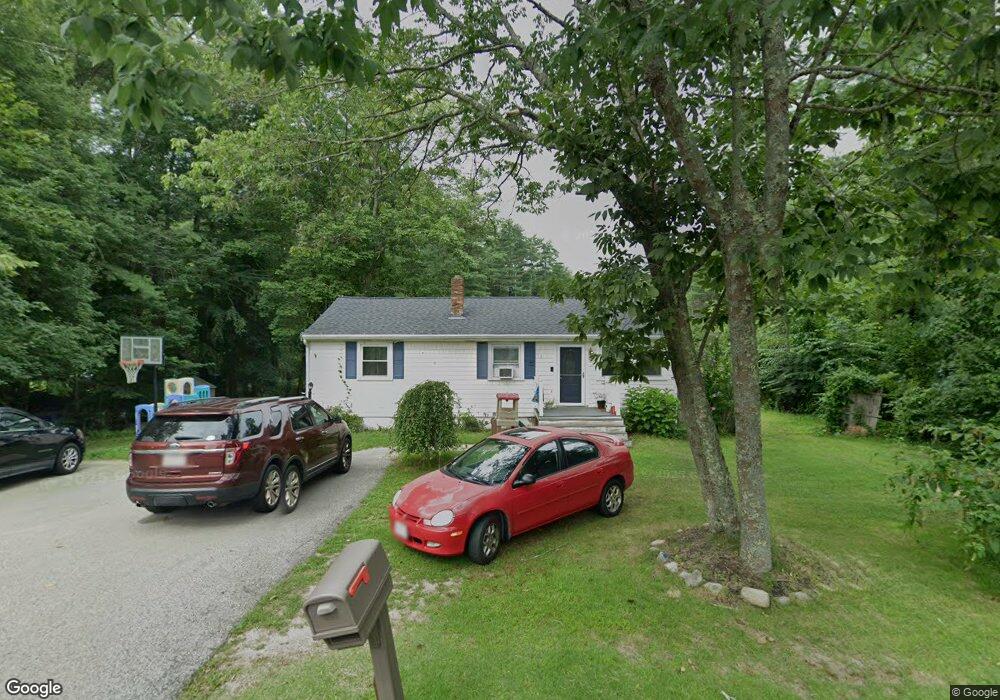
633 State St Hanson, MA 02341
Estimated Value: $471,010 - $567,000
3
Beds
1
Bath
960
Sq Ft
$547/Sq Ft
Est. Value
About This Home
This home is located at 633 State St, Hanson, MA 02341 and is currently estimated at $524,753, approximately $546 per square foot. 633 State St is a home located in Plymouth County with nearby schools including Cadence Academy Preschool - Hanover and Cardinal Cushing Centers.
Ownership History
Date
Name
Owned For
Owner Type
Purchase Details
Closed on
Oct 19, 2007
Sold by
Option One Mortgage Co
Bought by
Burgio Richard and Burgio Karen
Current Estimated Value
Home Financials for this Owner
Home Financials are based on the most recent Mortgage that was taken out on this home.
Original Mortgage
$232,800
Outstanding Balance
$146,263
Interest Rate
6.51%
Mortgage Type
Purchase Money Mortgage
Estimated Equity
$378,490
Purchase Details
Closed on
Oct 3, 2007
Sold by
Keller Karen M and Keller Robert C
Bought by
Deutsche Bank Natl T C
Home Financials for this Owner
Home Financials are based on the most recent Mortgage that was taken out on this home.
Original Mortgage
$232,800
Outstanding Balance
$146,263
Interest Rate
6.51%
Mortgage Type
Purchase Money Mortgage
Estimated Equity
$378,490
Purchase Details
Closed on
Mar 3, 2006
Sold by
Keller Karen M and Keller Robert C
Bought by
Hurst William and Hurst Rebecca Shipman
Create a Home Valuation Report for This Property
The Home Valuation Report is an in-depth analysis detailing your home's value as well as a comparison with similar homes in the area
Home Values in the Area
Average Home Value in this Area
Purchase History
| Date | Buyer | Sale Price | Title Company |
|---|---|---|---|
| Burgio Richard | $240,000 | -- | |
| Burgio Richard | $240,000 | -- | |
| Deutsche Bank Natl T C | $221,000 | -- | |
| Deutsche Bank Natl T C | $221,000 | -- | |
| Hurst William | $170,000 | -- | |
| Hurst William | $170,000 | -- |
Source: Public Records
Mortgage History
| Date | Status | Borrower | Loan Amount |
|---|---|---|---|
| Open | Hurst William | $232,800 | |
| Closed | Hurst William | $232,800 |
Source: Public Records
Tax History
| Year | Tax Paid | Tax Assessment Tax Assessment Total Assessment is a certain percentage of the fair market value that is determined by local assessors to be the total taxable value of land and additions on the property. | Land | Improvement |
|---|---|---|---|---|
| 2025 | $5,321 | $397,700 | $190,100 | $207,600 |
| 2024 | $5,169 | $386,300 | $184,600 | $201,700 |
| 2023 | $5,112 | $360,500 | $184,600 | $175,900 |
| 2022 | $4,947 | $327,800 | $167,800 | $160,000 |
| 2021 | $4,356 | $288,500 | $161,400 | $127,100 |
| 2020 | $4,259 | $278,900 | $155,900 | $123,000 |
| 2019 | $4,115 | $265,000 | $152,900 | $112,100 |
| 2018 | $4,339 | $238,400 | $147,000 | $91,400 |
| 2017 | $4,170 | $228,700 | $140,000 | $88,700 |
| 2016 | $3,724 | $225,000 | $140,000 | $85,000 |
| 2015 | $3,555 | $223,300 | $140,000 | $83,300 |
Source: Public Records
Map
Nearby Homes
- 339 State St
- 114 Graham Hill Dr
- 430 Brook Bend Rd
- 51 Farmside Dr
- 108 Waterford Dr
- 35 Sproul Rd
- 51 Cervelli Farm Dr
- 37 Dr
- 23 Cervelli Farm Dr
- 38 Cervelli Farm Dr
- 9 Cervelli Farm Dr
- 7 Farmside Dr
- 250 Center St
- 285 W Elm St
- 36 Grove St
- 60 Summer Path Way
- 139 Fairwood Dr
- 95 Tecumseh Dr
- 186 Elm St
- 26 Stonebridge Dr
Your Personal Tour Guide
Ask me questions while you tour the home.