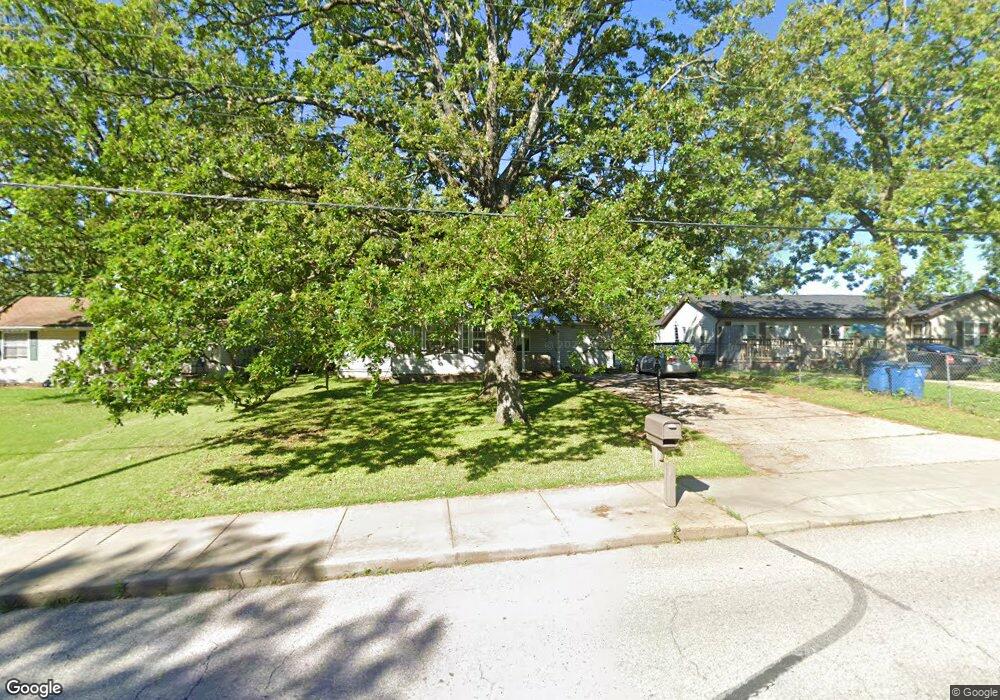
633 Vreeland Rd Hillsboro, MO 63050
Estimated Value: $166,687 - $218,000
--
Bed
--
Bath
1,080
Sq Ft
$171/Sq Ft
Est. Value
About This Home
This home is located at 633 Vreeland Rd, Hillsboro, MO 63050 and is currently estimated at $185,172, approximately $171 per square foot. 633 Vreeland Rd is a home located in Jefferson County with nearby schools including Hillsboro Elementary School, Hillsboro Primary School, and Hillsboro Junior High School.
Ownership History
Date
Name
Owned For
Owner Type
Purchase Details
Closed on
Apr 26, 2006
Sold by
Pritchett Leonard P and Pritchett Julie
Bought by
Daniels David M and Daniels Rebecca L
Current Estimated Value
Home Financials for this Owner
Home Financials are based on the most recent Mortgage that was taken out on this home.
Original Mortgage
$112,900
Outstanding Balance
$64,767
Interest Rate
6.33%
Mortgage Type
Fannie Mae Freddie Mac
Estimated Equity
$120,405
Purchase Details
Closed on
Dec 30, 2004
Sold by
Castle Rock Homes Llc
Bought by
Pritchett Ii Leonard P
Home Financials for this Owner
Home Financials are based on the most recent Mortgage that was taken out on this home.
Original Mortgage
$92,000
Interest Rate
10.25%
Mortgage Type
Purchase Money Mortgage
Purchase Details
Closed on
Mar 28, 2001
Sold by
Gary Bougeno and Kratochwil Kevin
Bought by
Kratochwil Kevin and Kratochwil Melodie
Home Financials for this Owner
Home Financials are based on the most recent Mortgage that was taken out on this home.
Original Mortgage
$52,500
Interest Rate
12.54%
Create a Home Valuation Report for This Property
The Home Valuation Report is an in-depth analysis detailing your home's value as well as a comparison with similar homes in the area
Home Values in the Area
Average Home Value in this Area
Purchase History
| Date | Buyer | Sale Price | Title Company |
|---|---|---|---|
| Daniels David M | -- | Ust | |
| Pritchett Ii Leonard P | -- | -- | |
| Castle Rock Homes Llc | -- | -- | |
| Kratochwil Kevin | -- | Montgomery Home Title |
Source: Public Records
Mortgage History
| Date | Status | Borrower | Loan Amount |
|---|---|---|---|
| Open | Daniels David M | $112,900 | |
| Previous Owner | Castle Rock Homes Llc | $92,000 | |
| Previous Owner | Kratochwil Kevin | $52,500 |
Source: Public Records
Tax History Compared to Growth
Tax History
| Year | Tax Paid | Tax Assessment Tax Assessment Total Assessment is a certain percentage of the fair market value that is determined by local assessors to be the total taxable value of land and additions on the property. | Land | Improvement |
|---|---|---|---|---|
| 2025 | $667 | $11,800 | $1,300 | $10,500 |
| 2024 | $667 | $10,800 | $1,300 | $9,500 |
| 2023 | $667 | $10,800 | $1,300 | $9,500 |
| 2022 | $669 | $10,800 | $1,300 | $9,500 |
| 2021 | $717 | $10,800 | $1,300 | $9,500 |
| 2020 | $677 | $9,900 | $1,000 | $8,900 |
| 2019 | $676 | $9,900 | $1,000 | $8,900 |
| 2018 | $680 | $9,900 | $1,000 | $8,900 |
| 2017 | $681 | $9,900 | $1,000 | $8,900 |
| 2016 | $673 | $9,300 | $1,500 | $7,800 |
| 2015 | $670 | $9,300 | $1,500 | $7,800 |
| 2013 | -- | $8,600 | $1,500 | $7,100 |
Source: Public Records
Map
Nearby Homes
- 569 Karen Dr
- 6005 Elm
- 4625 Cedar Dr
- 712 Maple St
- 719 Camelot Estates Dr
- 32 Ridgewood Dr
- 10430 Business 21
- 0 Lot 62 01 Acres Unit 23042037
- 10401 Highway Bb
- 4799 State Road B
- 10284 Micah Ln
- 0 Brickyard Rd
- 6360 State Road B
- 127 N Lake Dr
- 4640 Dylan Dr
- 4633 Dylan Dr
- 1483 Saint Charles Dr
- 5600 Forest Dr
- 9449 Hillsboro-House Springs Rd
- 10515 Eagles Nest Dr
- 637 Vreeland Rd
- 605 Vreeland Rd
- 4607 Oakwood Dr
- 587 Vreeland Rd
- 4600 Oakwood Dr
- 4612 Oakwood Dr
- 4613 Oakwood Dr
- 6063 Vreeland Dr
- 713 Vreeland Rd
- 4619 Oakwood Dr
- 4619 Oakwood Dr
- 733 Vreeland Rd
- 4625 Oakwood Dr
- 4622 Oakwood Dr
- 739 Vreeland Rd
- 4631 Oakwood Dr
- 4628 Oakwood Dr
- 745 Vreeland Rd
- 4637 Oakwood Dr
- 4632 Oakwood Dr