Estimated Value: $110,825 - $144,000
3
Beds
2
Baths
1,546
Sq Ft
$81/Sq Ft
Est. Value
About This Home
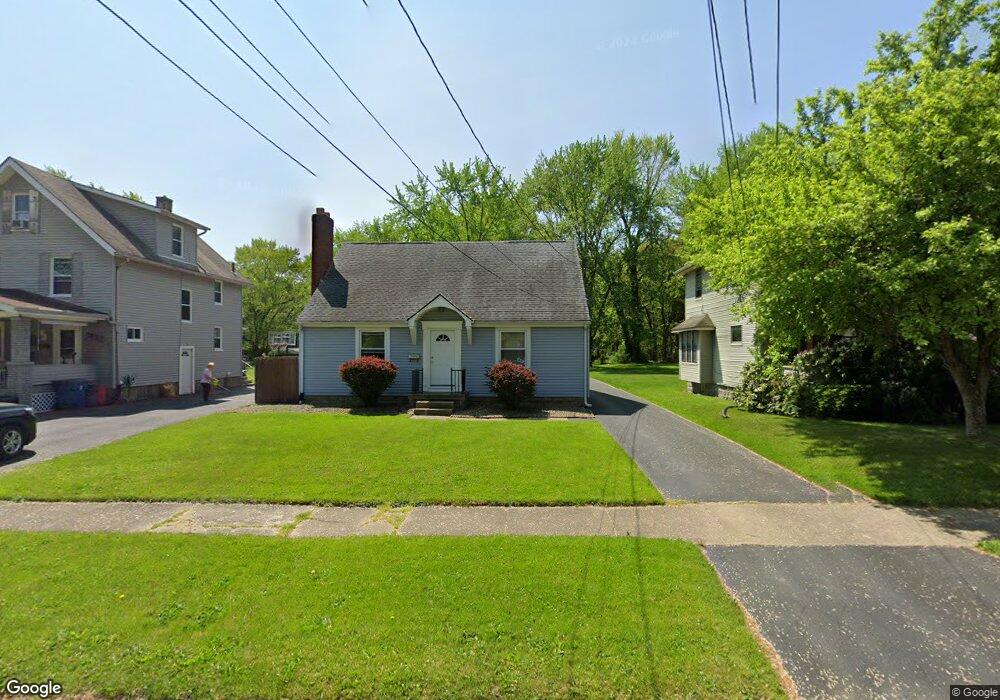
This home is located at 633 W 3rd St, Niles, OH 44446 and is currently estimated at $125,956, approximately $81 per square foot. 633 W 3rd St is a home located in Trumbull County with nearby schools including Niles Primary School, Niles Intermediate School, and Niles Middle School.
Ownership History
Date
Name
Owned For
Owner Type
Purchase Details
Closed on
Mar 27, 2001
Sold by
Jireh Properties Ltd
Bought by
Newell Marc A and Jolliff Gina M
Current Estimated Value
Purchase Details
Closed on
Mar 26, 2001
Sold by
Jireh Properties Ltd
Bought by
Newell Marc A and Jolliff Gina M
Purchase Details
Closed on
Jul 9, 1997
Sold by
Bowman Ronald L and Bowman Delena S
Bought by
Horrell William J
Home Financials for this Owner
Home Financials are based on the most recent Mortgage that was taken out on this home.
Original Mortgage
$72,962
Interest Rate
8%
Purchase Details
Closed on
Jan 1, 1990
Sold by
Carr Janice
Bought by
Ronald L Bowman
Create a Home Valuation Report for This Property
The Home Valuation Report is an in-depth analysis detailing your home's value as well as a comparison with similar homes in the area
Home Values in the Area
Average Home Value in this Area
Purchase History
| Date | Buyer | Sale Price | Title Company |
|---|---|---|---|
| Newell Marc A | $73,000 | -- | |
| Newell Marc A | $73,000 | -- | |
| Horrell William J | $73,000 | -- | |
| Ronald L Bowman | -- | -- |
Source: Public Records
Mortgage History
| Date | Status | Borrower | Loan Amount |
|---|---|---|---|
| Previous Owner | Horrell William J | $72,962 |
Source: Public Records
Tax History Compared to Growth
Tax History
| Year | Tax Paid | Tax Assessment Tax Assessment Total Assessment is a certain percentage of the fair market value that is determined by local assessors to be the total taxable value of land and additions on the property. | Land | Improvement |
|---|---|---|---|---|
| 2024 | $1,202 | $28,040 | $2,350 | $25,690 |
| 2023 | $1,202 | $28,040 | $2,350 | $25,690 |
| 2022 | $968 | $19,290 | $2,350 | $16,940 |
| 2021 | $1,017 | $19,290 | $2,350 | $16,940 |
| 2020 | $1,026 | $19,290 | $2,350 | $16,940 |
| 2019 | $992 | $17,750 | $2,350 | $15,400 |
| 2018 | $989 | $17,750 | $2,350 | $15,400 |
| 2017 | $984 | $17,750 | $2,350 | $15,400 |
| 2016 | $1,173 | $20,970 | $2,350 | $18,620 |
| 2015 | $1,161 | $20,970 | $2,350 | $18,620 |
| 2014 | $1,165 | $20,970 | $2,350 | $18,620 |
| 2013 | $1,238 | $23,530 | $2,350 | $21,180 |
Source: Public Records
Map
Nearby Homes
- 643 Nebraska Ave
- 323 W State St
- 46 & 48 Hyde Ave
- 240 Warren Ave
- 22 N Arlington Ave
- 158 N Arlington Ave
- 0 Federal
- 512 John St
- 512 W Federal St
- 611 Mason St
- 409 West St
- 322 Morse Ave
- 4,6,8 Lafayette
- 416 N Cedar Ave
- 816 Fenton St
- 719 Robbins Ave
- 39 Belmont Ave
- 17 Belmont Ave
- 145 North Rd
- 1721 Ohltown McDonald Rd