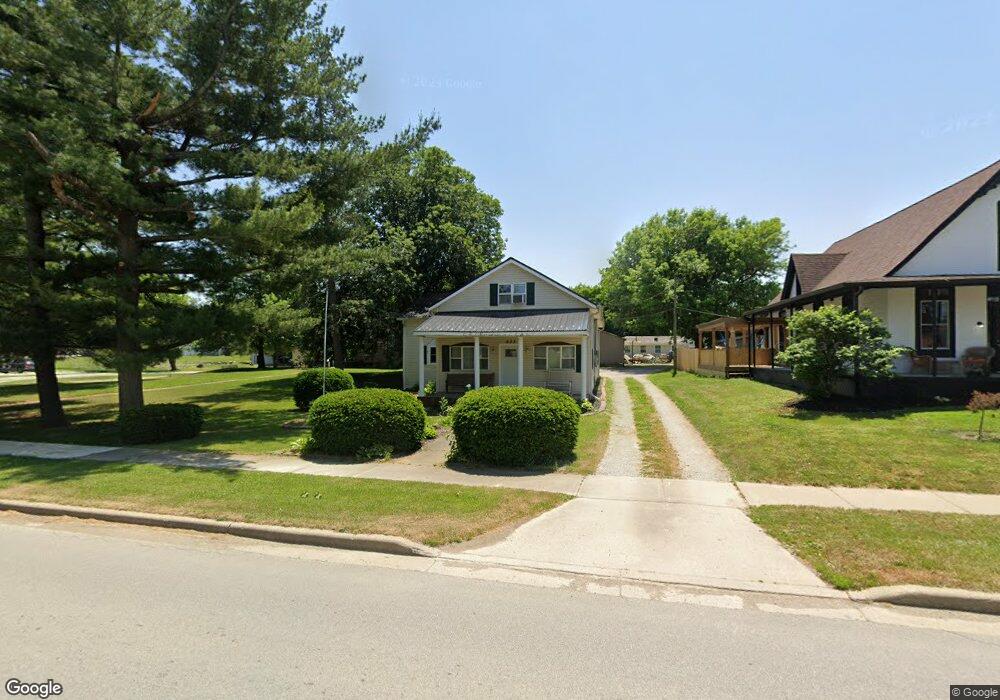
633 W Main St Thorntown, IN 46071
Estimated Value: $185,000 - $270,026
5
Beds
3
Baths
1,652
Sq Ft
$150/Sq Ft
Est. Value
About This Home
This home is located at 633 W Main St, Thorntown, IN 46071 and is currently estimated at $247,007, approximately $149 per square foot. 633 W Main St is a home located in Boone County with nearby schools including Western Boone Junior/Senior High School.
Ownership History
Date
Name
Owned For
Owner Type
Purchase Details
Closed on
Sep 17, 2008
Sold by
Fisher Michael T and Fisher Diane L
Bought by
Fisher Michael T and Fisher Diane L
Current Estimated Value
Home Financials for this Owner
Home Financials are based on the most recent Mortgage that was taken out on this home.
Original Mortgage
$173,481
Interest Rate
6.57%
Mortgage Type
Purchase Money Mortgage
Create a Home Valuation Report for This Property
The Home Valuation Report is an in-depth analysis detailing your home's value as well as a comparison with similar homes in the area
Home Values in the Area
Average Home Value in this Area
Purchase History
| Date | Buyer | Sale Price | Title Company |
|---|---|---|---|
| Fisher Michael T | -- | -- |
Source: Public Records
Mortgage History
| Date | Status | Borrower | Loan Amount |
|---|---|---|---|
| Closed | Fisher Michael T | $173,481 |
Source: Public Records
Tax History Compared to Growth
Tax History
| Year | Tax Paid | Tax Assessment Tax Assessment Total Assessment is a certain percentage of the fair market value that is determined by local assessors to be the total taxable value of land and additions on the property. | Land | Improvement |
|---|---|---|---|---|
| 2025 | $1,765 | $234,600 | $18,200 | $216,400 |
| 2024 | $1,765 | $218,400 | $18,200 | $200,200 |
| 2023 | $1,880 | $201,200 | $18,200 | $183,000 |
| 2022 | $1,840 | $190,400 | $18,200 | $172,200 |
| 2021 | $1,614 | $163,400 | $18,200 | $145,200 |
| 2020 | $1,399 | $148,900 | $18,200 | $130,700 |
| 2019 | $1,324 | $145,000 | $18,200 | $126,800 |
| 2018 | $1,233 | $139,100 | $18,200 | $120,900 |
| 2017 | $1,109 | $131,300 | $18,200 | $113,100 |
| 2016 | $963 | $123,400 | $18,200 | $105,200 |
| 2014 | $826 | $112,800 | $18,200 | $94,600 |
| 2013 | $881 | $112,800 | $18,200 | $94,600 |
Source: Public Records
Map
Nearby Homes
- 223 S West St
- 117 N Market St
- 1323 Locust Place
- 1321 Locust Place
- 328 N Front St
- Ironwood Plan at Northwood Haven
- Spruce Plan at Northwood Haven
- Ashton Plan at Northwood Haven
- Palmetto Plan at Northwood Haven
- Bradford Plan at Northwood Haven
- Aspen II Plan at Northwood Haven
- Empress Plan at Northwood Haven
- Juniper Plan at Northwood Haven
- Chestnut Plan at Northwood Haven
- Norway Plan at Northwood Haven
- Cooper Plan at Northwood Haven
- 6139 Westfall Dr
- Juniper Plan at Westfall Place
- Chestnut Plan at Westfall Place
- Walnut Plan at Westfall Place