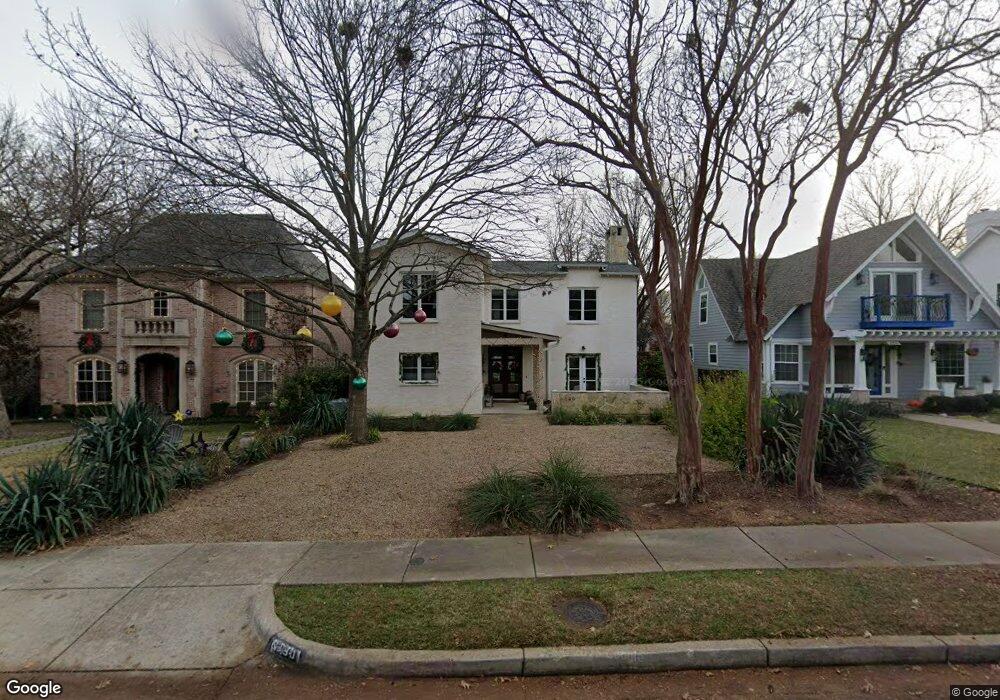
6330 Vanderbilt Ave Dallas, TX 75214
Lakewood NeighborhoodEstimated Value: $1,489,000 - $1,805,000
4
Beds
4
Baths
3,515
Sq Ft
$459/Sq Ft
Est. Value
About This Home
This home is located at 6330 Vanderbilt Ave, Dallas, TX 75214 and is currently estimated at $1,611,716, approximately $458 per square foot. 6330 Vanderbilt Ave is a home located in Dallas County with nearby schools including Mockingbird Elementary School, J L Long Middle School, and Woodrow Wilson High School.
Ownership History
Date
Name
Owned For
Owner Type
Purchase Details
Closed on
Apr 20, 2001
Sold by
Caughran Aaron M and Caughran Barbara
Bought by
Edlabadkar Vivek H
Current Estimated Value
Home Financials for this Owner
Home Financials are based on the most recent Mortgage that was taken out on this home.
Original Mortgage
$145,350
Outstanding Balance
$53,502
Interest Rate
7%
Estimated Equity
$1,558,214
Purchase Details
Closed on
May 14, 1998
Sold by
Duryee Melinda Kay Brown and Duryee William H
Bought by
Caughran Aaron M and Caughran Barbara
Home Financials for this Owner
Home Financials are based on the most recent Mortgage that was taken out on this home.
Original Mortgage
$113,139
Interest Rate
7.18%
Mortgage Type
FHA
Create a Home Valuation Report for This Property
The Home Valuation Report is an in-depth analysis detailing your home's value as well as a comparison with similar homes in the area
Home Values in the Area
Average Home Value in this Area
Purchase History
| Date | Buyer | Sale Price | Title Company |
|---|---|---|---|
| Edlabadkar Vivek H | -- | -- | |
| Caughran Aaron M | -- | -- |
Source: Public Records
Mortgage History
| Date | Status | Borrower | Loan Amount |
|---|---|---|---|
| Open | Edlabadkar Vivek H | $145,350 | |
| Previous Owner | Caughran Aaron M | $113,139 |
Source: Public Records
Tax History Compared to Growth
Tax History
| Year | Tax Paid | Tax Assessment Tax Assessment Total Assessment is a certain percentage of the fair market value that is determined by local assessors to be the total taxable value of land and additions on the property. | Land | Improvement |
|---|---|---|---|---|
| 2025 | $24,301 | $1,574,180 | $658,500 | $915,680 |
| 2024 | $24,301 | $1,470,690 | $658,500 | $812,190 |
| 2023 | $24,301 | $1,486,110 | $658,500 | $827,610 |
| 2022 | $30,665 | $1,226,410 | $439,000 | $787,410 |
| 2021 | $26,560 | $1,006,840 | $439,000 | $567,840 |
| 2020 | $25,973 | $957,390 | $384,130 | $573,260 |
| 2019 | $27,240 | $957,390 | $384,130 | $573,260 |
| 2018 | $26,033 | $957,390 | $384,130 | $573,260 |
| 2017 | $22,626 | $832,040 | $329,250 | $502,790 |
| 2016 | $22,626 | $832,040 | $329,250 | $502,790 |
| 2015 | $17,478 | $760,820 | $296,330 | $464,490 |
| 2014 | $17,478 | $760,820 | $296,330 | $464,490 |
Source: Public Records
Map
Nearby Homes
- 6339 Velasco Ave
- 6215 Llano Ave
- 6211 Marquita Ave
- 6424 Marquita Ave
- 6334 Velasco Ave
- 6163 Vanderbilt Ave
- 6211 Velasco Ave
- 6235 Palo Pinto Ave
- 6145 Llano Ave
- 6145 Marquita Ave
- 6159 Velasco Ave
- 6135 Marquita Ave
- 6326 Lakeshore Dr
- 6227 Lakeshore Dr
- 6234 Lakeshore Dr
- 6218 Lakeshore Dr
- 6743 Sondra Dr
- 4 Nonesuch Rd
- 6038 Goodwin Ave
- 6039 Goodwin Ave
- 6326 Vanderbilt Ave
- 6334 Vanderbilt Ave
- 6322 Vanderbilt Ave
- 6338 Vanderbilt Ave
- 6318 Vanderbilt Ave
- 6342 Vanderbilt Ave
- 6314 Vanderbilt Ave
- 6346 Vanderbilt Ave
- 6331 Vickery Blvd
- 6327 Vickery Blvd
- 6333 Vickery Blvd
- 6323 Vickery Blvd
- 6310 Vanderbilt Ave
- 6350 Vanderbilt Ave
- 6327 Vanderbilt Ave
- 6317 Vickery Blvd
- 6325 Vanderbilt Ave
- 6335 Vanderbilt Ave
- 6321 Vanderbilt Ave
- 6341 Vanderbilt Ave