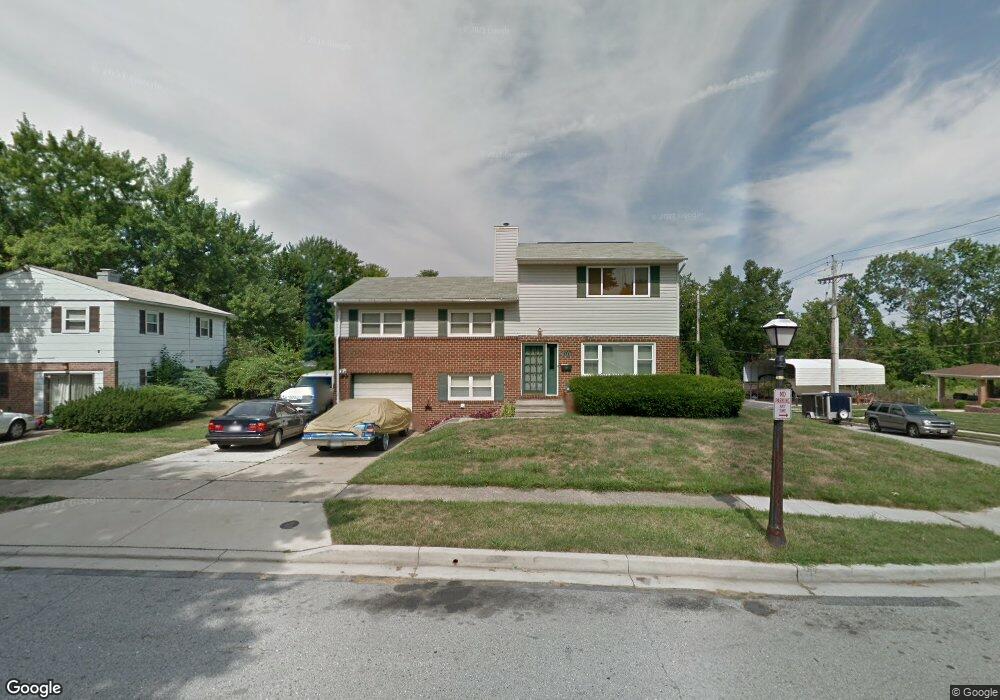
6331 Craigmont Rd Catonsville, MD 21228
Estimated Value: $321,000 - $487,000
--
Bed
3
Baths
2,200
Sq Ft
$193/Sq Ft
Est. Value
About This Home
This home is located at 6331 Craigmont Rd, Catonsville, MD 21228 and is currently estimated at $424,287, approximately $192 per square foot. 6331 Craigmont Rd is a home located in Baltimore County with nearby schools including Johnnycake Elementary School, Southwest Academy, and Woodlawn High School.
Ownership History
Date
Name
Owned For
Owner Type
Purchase Details
Closed on
Jan 13, 2005
Sold by
Jones Leon B
Bought by
Jones Leon B
Current Estimated Value
Home Financials for this Owner
Home Financials are based on the most recent Mortgage that was taken out on this home.
Original Mortgage
$171,500
Outstanding Balance
$85,440
Interest Rate
5.55%
Mortgage Type
Adjustable Rate Mortgage/ARM
Estimated Equity
$338,847
Purchase Details
Closed on
Oct 3, 2000
Sold by
Secretary Of Housing
Bought by
Jones Leon B and Jones Stephanie K
Purchase Details
Closed on
Jul 28, 2000
Sold by
Henson Clayton M
Bought by
Secretary Of Housing and Urban Development
Purchase Details
Closed on
Jun 2, 1995
Sold by
Fries Charles W
Bought by
Henson Clayton M
Home Financials for this Owner
Home Financials are based on the most recent Mortgage that was taken out on this home.
Original Mortgage
$103,477
Interest Rate
8.2%
Create a Home Valuation Report for This Property
The Home Valuation Report is an in-depth analysis detailing your home's value as well as a comparison with similar homes in the area
Home Values in the Area
Average Home Value in this Area
Purchase History
| Date | Buyer | Sale Price | Title Company |
|---|---|---|---|
| Jones Leon B | -- | -- | |
| Jones Leon B | $93,000 | -- | |
| Secretary Of Housing | $110,000 | -- | |
| Henson Clayton M | $105,000 | -- |
Source: Public Records
Mortgage History
| Date | Status | Borrower | Loan Amount |
|---|---|---|---|
| Open | Jones Leon B | $171,500 | |
| Previous Owner | Henson Clayton M | $103,477 |
Source: Public Records
Tax History Compared to Growth
Tax History
| Year | Tax Paid | Tax Assessment Tax Assessment Total Assessment is a certain percentage of the fair market value that is determined by local assessors to be the total taxable value of land and additions on the property. | Land | Improvement |
|---|---|---|---|---|
| 2025 | $3,376 | $310,667 | -- | -- |
| 2024 | $3,376 | $285,300 | $79,800 | $205,500 |
| 2023 | $1,766 | $266,100 | $0 | $0 |
| 2022 | $3,224 | $246,900 | $0 | $0 |
| 2021 | $3,198 | $227,700 | $79,800 | $147,900 |
| 2020 | $3,198 | $227,467 | $0 | $0 |
| 2019 | $2,913 | $227,233 | $0 | $0 |
| 2018 | $2,731 | $227,000 | $66,300 | $160,700 |
| 2017 | $2,521 | $215,800 | $0 | $0 |
| 2016 | $2,074 | $204,600 | $0 | $0 |
| 2015 | $2,074 | $193,400 | $0 | $0 |
| 2014 | $2,074 | $193,400 | $0 | $0 |
Source: Public Records
Map
Nearby Homes
- 1009 Rowe Ln
- 800 Crosby Rd
- 1418 Harberson Rd
- 6011 Johnnycake Rd
- 1007 Marksworth Rd
- 6028 Moorehead Rd
- 1124 Brigadoon Trail
- 6001 Johnnycake Rd
- 1007 Kent Ave
- 1109 Marksworth Rd
- 1102 Kent Ave
- 6031 Burnt Oak Rd
- 910 Prestwood Rd
- 1113 Kent Ave
- 930 Sedgley Rd
- 920 Vanderwood Rd
- 1124 Dorchester Ave
- 908 Vanderwood Rd
- 5932 Saint Marys St
- 6200 Gilston Park Rd
- 6329 Craigmont Rd
- 6401 Craigmont Rd
- 6327 Craigmont Rd
- 6328 Craigmont Rd
- 6325 Craigmont Rd
- 6326 Craigmont Rd
- 6320 Johnnycake Rd
- 6324 Craigmont Rd
- 6323 Craigmont Rd
- 6319 Johnnycake Rd
- 6403 Craigmont Rd
- 6318 Johnnycake Rd
- 6322 Craigmont Rd
- 6321 Craigmont Rd
- 6402 Craigmont Rd
- 6407 Craigmont Rd
- 6317 Johnnycake Rd
- 6405 Craigmont Rd
- 6316 Johnnycake Rd
- 6320 Craigmont Rd