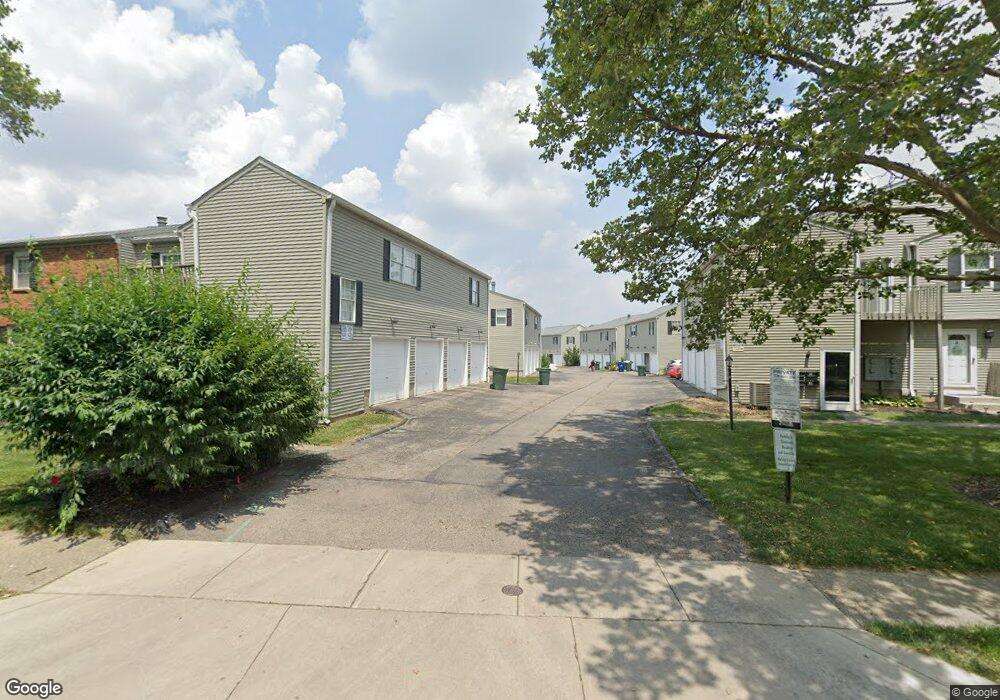
6331 Well Fleet Dr Unit 81 Columbus, OH 43231
Northern Woods NeighborhoodEstimated Value: $163,760 - $192,000
2
Beds
1
Bath
968
Sq Ft
$185/Sq Ft
Est. Value
About This Home
This home is located at 6331 Well Fleet Dr Unit 81, Columbus, OH 43231 and is currently estimated at $179,440, approximately $185 per square foot. 6331 Well Fleet Dr Unit 81 is a home located in Franklin County with nearby schools including Fouse Elementary School, Genoa Middle School, and Westerville Central High School.
Ownership History
Date
Name
Owned For
Owner Type
Purchase Details
Closed on
Jan 30, 2008
Sold by
Mckenna Christine A and Babione Christine Mckenna
Bought by
Mather Robert J
Current Estimated Value
Home Financials for this Owner
Home Financials are based on the most recent Mortgage that was taken out on this home.
Original Mortgage
$73,000
Outstanding Balance
$46,430
Interest Rate
6.22%
Mortgage Type
Purchase Money Mortgage
Estimated Equity
$133,010
Purchase Details
Closed on
May 10, 2004
Sold by
Piepho Marilyn A
Bought by
Mckenna Christine A
Home Financials for this Owner
Home Financials are based on the most recent Mortgage that was taken out on this home.
Original Mortgage
$62,500
Interest Rate
5.85%
Mortgage Type
Purchase Money Mortgage
Purchase Details
Closed on
Dec 14, 1981
Bought by
Piepho Marilyn A
Purchase Details
Closed on
Jul 1, 1980
Create a Home Valuation Report for This Property
The Home Valuation Report is an in-depth analysis detailing your home's value as well as a comparison with similar homes in the area
Home Values in the Area
Average Home Value in this Area
Purchase History
| Date | Buyer | Sale Price | Title Company |
|---|---|---|---|
| Mather Robert J | $73,000 | Hummel Titl | |
| Mckenna Christine A | $87,500 | -- | |
| Piepho Marilyn A | -- | -- | |
| -- | $43,000 | -- |
Source: Public Records
Mortgage History
| Date | Status | Borrower | Loan Amount |
|---|---|---|---|
| Open | Mather Robert J | $73,000 | |
| Previous Owner | Mckenna Christine A | $62,500 |
Source: Public Records
Tax History Compared to Growth
Tax History
| Year | Tax Paid | Tax Assessment Tax Assessment Total Assessment is a certain percentage of the fair market value that is determined by local assessors to be the total taxable value of land and additions on the property. | Land | Improvement |
|---|---|---|---|---|
| 2024 | $2,114 | $42,420 | $9,100 | $33,320 |
| 2023 | $2,063 | $42,420 | $9,100 | $33,320 |
| 2022 | $1,726 | $27,090 | $3,500 | $23,590 |
| 2021 | $1,743 | $27,090 | $3,500 | $23,590 |
| 2020 | $1,737 | $27,090 | $3,500 | $23,590 |
| 2019 | $1,456 | $21,670 | $2,800 | $18,870 |
| 2018 | $1,482 | $21,670 | $2,800 | $18,870 |
| 2017 | $1,482 | $21,670 | $2,800 | $18,870 |
| 2016 | $1,537 | $21,290 | $3,820 | $17,470 |
| 2015 | $1,541 | $21,290 | $3,820 | $17,470 |
| 2014 | $1,542 | $21,290 | $3,820 | $17,470 |
| 2013 | $852 | $23,625 | $4,235 | $19,390 |
Source: Public Records
Map
Nearby Homes
- 2721 Woodland Trail Dr Unit 2721
- 2727 Patrick Ave
- 2677-2679 Blossom Ave
- 3066 Ravine Pointe Dr Unit 3066
- 2981 Blendon Woods Blvd Unit 983
- 3038 Highcliff Ct
- 3001 Cooper Bluff Dr Unit 3001
- 3076 Blendon Woods Blvd
- 2292 Laurelwood Dr Unit 2292L
- 3070 Highcliff Ct Unit 3070
- 2800 Overview Ct Unit 2800B
- 3068 Highcliff Ct Unit 3068
- 2197 Bayfield Dr
- 6048 Pinemoor St
- 5841 Forest Hills Blvd Unit 5843
- 2120 Willowick Dr Unit B
- 465 W Schrock Rd
- 6658 Walbridge St
- 5678 Great Hall Ct Unit 12C
- 6448 Sharon Woods Blvd Unit B
- 6335 Well Fleet Dr Unit 83
- 6333 Well Fleet Dr
- 6333 Well Fleet Dr Unit 82
- 6337 Well Fleet Dr Unit 84
- 6332 Well Fleet Dr Unit 85
- 6341 Well Fleet Dr Unit 90
- 6339 Well Fleet Dr Unit 89
- 6327 Well Fleet Dr
- 6336 Well Fleet Dr Unit 87
- 6334 Well Fleet Dr
- 6334 Well Fleet Dr Unit 86
- 6345 Well Fleet Dr Unit 92
- 6323 Well Fleet Dr Unit 73
- 6340 Well Fleet Dr Unit 93
- 6325 Well Fleet Dr
- 6329 Well Fleet Dr Unit 76
- 6344 Well Fleet Dr Unit 95
- 6328 Well Fleet Dr Unit 79
- 6342 Well Fleet Dr Unit 94
- 6349 Well Fleet Dr