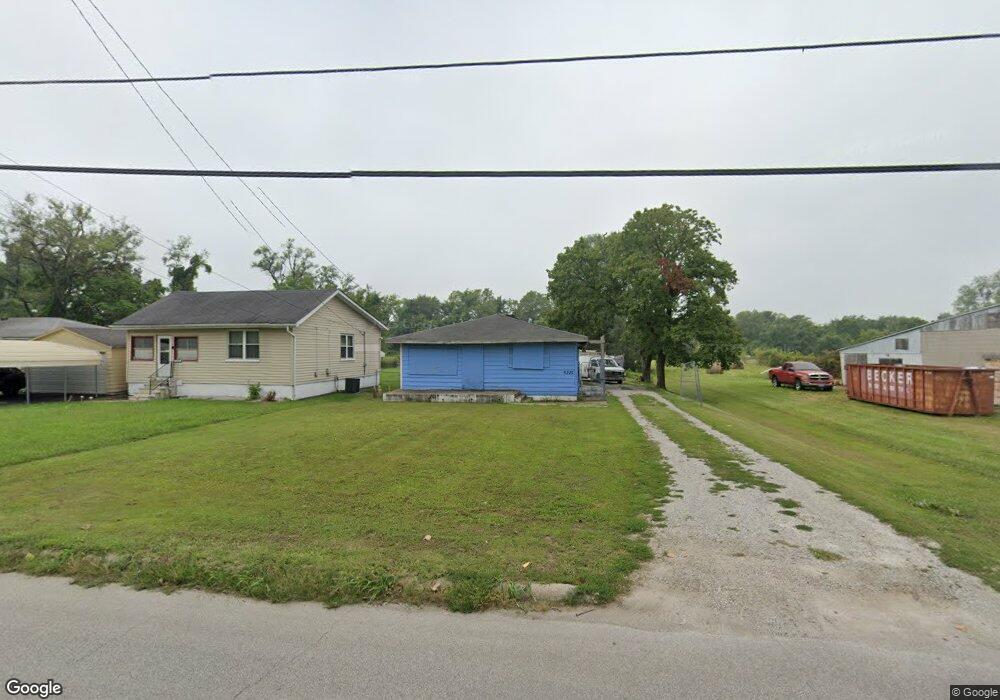
6332 Church Rd East Saint Louis, IL 62207
Estimated Value: $32,000 - $38,214
--
Bed
--
Bath
1,120
Sq Ft
$31/Sq Ft
Est. Value
About This Home
This home is located at 6332 Church Rd, East Saint Louis, IL 62207 and is currently estimated at $35,071, approximately $31 per square foot. 6332 Church Rd is a home located in St. Clair County.
Ownership History
Date
Name
Owned For
Owner Type
Purchase Details
Closed on
Mar 23, 2016
Sold by
Stanley Ellis R and Stanley Mollie
Bought by
Curry Michael
Current Estimated Value
Purchase Details
Closed on
Sep 23, 2015
Sold by
Saint Clair County
Bought by
Stanley Ellis R and Stanley Mollie
Purchase Details
Closed on
Jul 27, 2015
Sold by
County Of Saint Clair
Bought by
Saint Clair County and Trust #07-05-0-407-014
Purchase Details
Closed on
Feb 4, 2005
Sold by
St Clair County
Bought by
Nichols Fallon N and Frazier Lucille L
Purchase Details
Closed on
Jul 29, 2003
Sold by
Delaney Bob
Bought by
St Clair County
Create a Home Valuation Report for This Property
The Home Valuation Report is an in-depth analysis detailing your home's value as well as a comparison with similar homes in the area
Home Values in the Area
Average Home Value in this Area
Purchase History
| Date | Buyer | Sale Price | Title Company |
|---|---|---|---|
| Curry Michael | -- | None Available | |
| Stanley Ellis R | -- | Attorney | |
| Saint Clair County | -- | Attorney | |
| Nichols Fallon N | -- | -- | |
| St Clair County | -- | -- |
Source: Public Records
Tax History Compared to Growth
Tax History
| Year | Tax Paid | Tax Assessment Tax Assessment Total Assessment is a certain percentage of the fair market value that is determined by local assessors to be the total taxable value of land and additions on the property. | Land | Improvement |
|---|---|---|---|---|
| 2024 | $153 | $6,799 | $1,641 | $5,158 |
| 2023 | $50 | $6,145 | $1,483 | $4,662 |
| 2022 | $1,071 | $5,386 | $1,300 | $4,086 |
| 2021 | $1,119 | $5,104 | $1,232 | $3,872 |
| 2020 | $1,773 | $8,088 | $1,291 | $6,797 |
| 2019 | $625 | $2,787 | $1,291 | $1,496 |
| 2018 | $625 | $2,828 | $1,310 | $1,518 |
| 2017 | $839 | $5,158 | $1,278 | $3,880 |
| 2016 | $571 | $2,422 | $1,274 | $1,148 |
| 2014 | $455 | $2,395 | $1,260 | $1,135 |
| 2013 | $300 | $2,247 | $1,182 | $1,065 |
Source: Public Records
Map
Nearby Homes