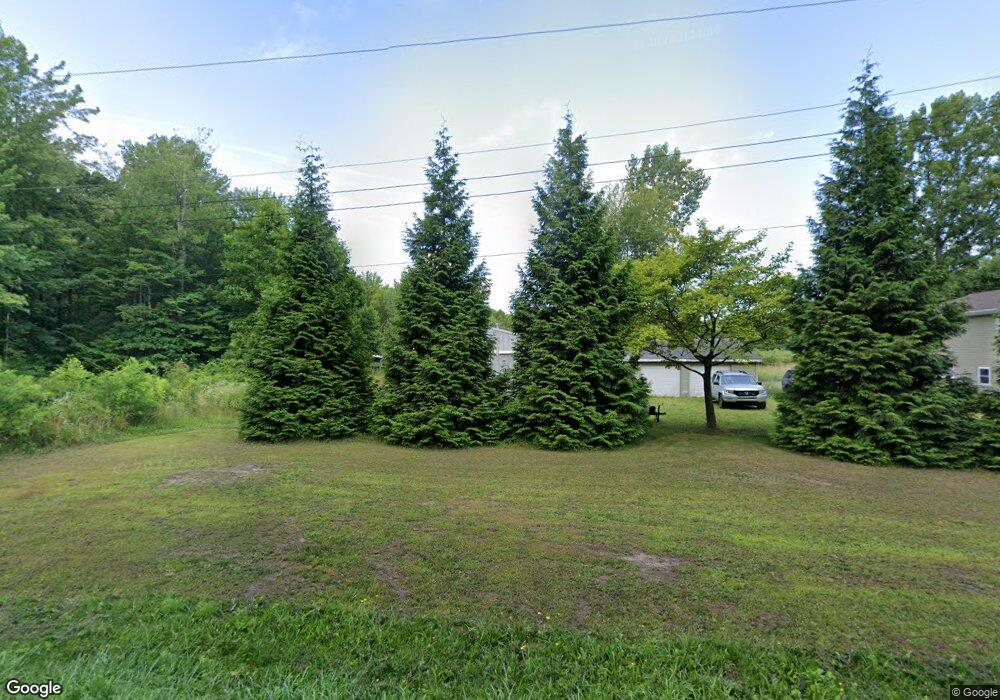
6332 Defield Rd Coloma, MI 49038
Estimated Value: $262,000 - $285,670
3
Beds
2
Baths
2,296
Sq Ft
$119/Sq Ft
Est. Value
About This Home
This home is located at 6332 Defield Rd, Coloma, MI 49038 and is currently estimated at $272,418, approximately $118 per square foot. 6332 Defield Rd is a home located in Berrien County with nearby schools including Coloma Elementary School, Coloma Intermediate School, and Coloma Junior High School.
Ownership History
Date
Name
Owned For
Owner Type
Purchase Details
Closed on
Oct 22, 2019
Sold by
Nord Bryan J
Bought by
Nord Bryan J and Bryan J Nord Wealth Family Tru
Current Estimated Value
Purchase Details
Closed on
Jan 27, 2017
Sold by
Nord Stephanie J and Nord Bryan J
Bought by
Nord Bryan J and Nord Stephanie J
Home Financials for this Owner
Home Financials are based on the most recent Mortgage that was taken out on this home.
Original Mortgage
$67,000
Outstanding Balance
$55,659
Interest Rate
4.32%
Mortgage Type
New Conventional
Estimated Equity
$216,759
Purchase Details
Closed on
Aug 14, 2008
Sold by
Nord Bryan J and Nord Stephanie J
Bought by
Nord Bryan J and Nord Stephanie J
Home Financials for this Owner
Home Financials are based on the most recent Mortgage that was taken out on this home.
Original Mortgage
$92,000
Interest Rate
6.42%
Mortgage Type
New Conventional
Purchase Details
Closed on
Oct 5, 2000
Purchase Details
Closed on
Jun 7, 1996
Create a Home Valuation Report for This Property
The Home Valuation Report is an in-depth analysis detailing your home's value as well as a comparison with similar homes in the area
Home Values in the Area
Average Home Value in this Area
Purchase History
| Date | Buyer | Sale Price | Title Company |
|---|---|---|---|
| Nord Bryan J | -- | None Available | |
| Nord Bryan J | -- | First American Title | |
| Nord Bryan J | -- | Metropolitan Title Company | |
| -- | $114,900 | -- | |
| -- | $76,500 | -- |
Source: Public Records
Mortgage History
| Date | Status | Borrower | Loan Amount |
|---|---|---|---|
| Open | Nord Bryan J | $67,000 | |
| Closed | Nord Bryan J | $92,000 |
Source: Public Records
Tax History
| Year | Tax Paid | Tax Assessment Tax Assessment Total Assessment is a certain percentage of the fair market value that is determined by local assessors to be the total taxable value of land and additions on the property. | Land | Improvement |
|---|---|---|---|---|
| 2025 | $1,856 | $115,200 | $0 | $0 |
| 2024 | $680 | $108,700 | $0 | $0 |
| 2023 | $647 | $92,900 | $0 | $0 |
| 2022 | $616 | $78,900 | $0 | $0 |
| 2021 | $1,707 | $72,800 | $8,700 | $64,100 |
| 2020 | $1,722 | $64,800 | $0 | $0 |
| 2019 | $1,745 | $59,200 | $8,700 | $50,500 |
| 2018 | $1,557 | $59,200 | $0 | $0 |
| 2017 | $1,545 | $59,200 | $0 | $0 |
| 2016 | $1,499 | $58,700 | $0 | $0 |
| 2015 | $1,475 | $57,800 | $0 | $0 |
| 2014 | $537 | $49,400 | $0 | $0 |
Source: Public Records
Map
Nearby Homes
- 6229 N Becht Rd
- 0 Becht Rd
- 6235 Hilda St
- 5682 Topanga Dr
- 6341 Johnson Rd
- 5081 Woodward
- 0 Sycamore Bluff
- 7574 Little Paw Lake Rd
- 5568 Paw Lake Rd
- 4801 Wil-O-paw Dr
- 7030 N Maple Dr
- 5586 Paw Lake Rd
- 6950 Shore Dr
- 2916 Pershing Dr
- 78720 County Road 376
- 6609 Hollywood Dr
- 0 Wilson St
- 43278 Whispering Pines Path Unit 9
- 4874 Knoll Ct
- 4568 Wil-O-paw Dr
- 6332 Defield Rd
- 6278 Defield Rd
- 6278 Defield Rd
- 6268 Defield Rd
- 6378 Defield Rd
- 6394 Defield Rd
- 6393 Defield Rd
- 6229 Defield Rd
- 6424 Defield Rd
- 6209 Defield Rd
- 6188 Defield Rd
- 6188 Defield Rd
- 6171 Defield Rd
- 6166 Defield Rd
- 6080 Hagar Shore Rd
- 6163 Defield Rd
- 6052 Hagar Shore Rd
- 6028 Hagar Shore Rd
- 6126 Defield Rd
- 5984 Hagar Shore Rd
Your Personal Tour Guide
Ask me questions while you tour the home.