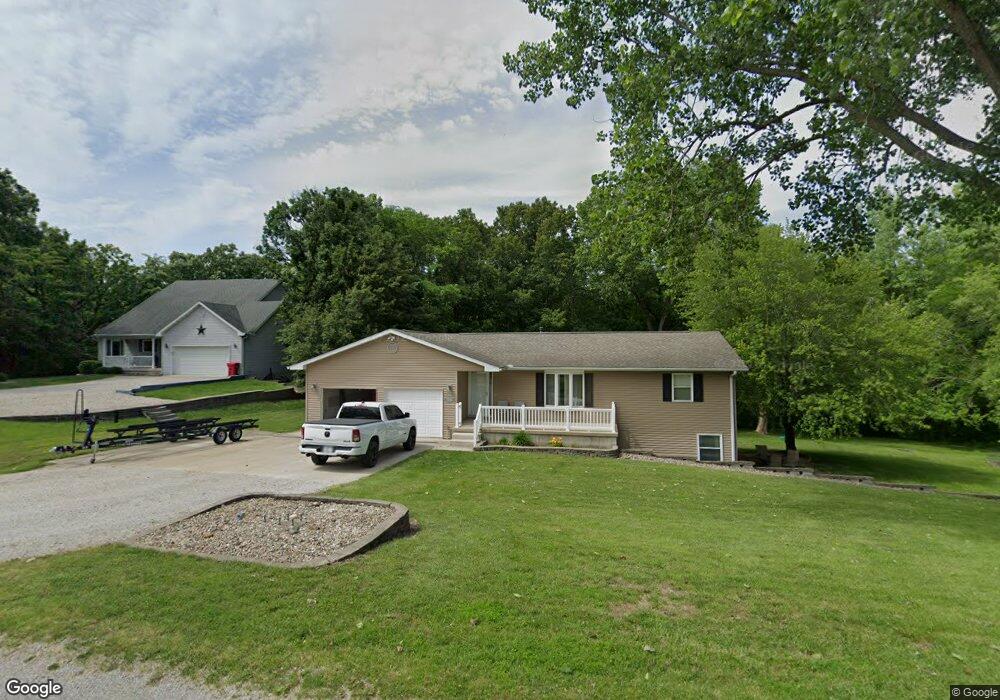
6332 Venetian Way Dr Mount Zion, IL 62549
Estimated Value: $243,000 - $293,000
--
Bed
--
Bath
1,352
Sq Ft
$196/Sq Ft
Est. Value
About This Home
This home is located at 6332 Venetian Way Dr, Mount Zion, IL 62549 and is currently estimated at $265,181, approximately $196 per square foot. 6332 Venetian Way Dr is a home located in Macon County with nearby schools including McGaughey Elementary School, Mt. Zion Intermediate School, and Mt. Zion Elementary School.
Ownership History
Date
Name
Owned For
Owner Type
Purchase Details
Closed on
May 1, 2018
Sold by
Wright Wade T
Bought by
Risley Rick A and Risley Jennifer K
Current Estimated Value
Home Financials for this Owner
Home Financials are based on the most recent Mortgage that was taken out on this home.
Original Mortgage
$155,600
Outstanding Balance
$134,131
Interest Rate
4.45%
Mortgage Type
New Conventional
Estimated Equity
$131,050
Purchase Details
Closed on
Aug 8, 2007
Sold by
Harding Kenneth E and Harding Christelle
Bought by
Wright Wade T
Home Financials for this Owner
Home Financials are based on the most recent Mortgage that was taken out on this home.
Original Mortgage
$25,400
Interest Rate
6.69%
Mortgage Type
Future Advance Clause Open End Mortgage
Purchase Details
Closed on
Feb 1, 2001
Create a Home Valuation Report for This Property
The Home Valuation Report is an in-depth analysis detailing your home's value as well as a comparison with similar homes in the area
Home Values in the Area
Average Home Value in this Area
Purchase History
| Date | Buyer | Sale Price | Title Company |
|---|---|---|---|
| Risley Rick A | $194,500 | -- | |
| Wright Wade T | $127,000 | None Available | |
| -- | $106,000 | -- |
Source: Public Records
Mortgage History
| Date | Status | Borrower | Loan Amount |
|---|---|---|---|
| Open | Risley Rick A | $155,600 | |
| Previous Owner | Wright Wade T | $25,400 | |
| Previous Owner | Wright Wade T | $101,600 |
Source: Public Records
Tax History Compared to Growth
Tax History
| Year | Tax Paid | Tax Assessment Tax Assessment Total Assessment is a certain percentage of the fair market value that is determined by local assessors to be the total taxable value of land and additions on the property. | Land | Improvement |
|---|---|---|---|---|
| 2024 | $4,816 | $78,449 | $6,050 | $72,399 |
| 2023 | $4,651 | $72,962 | $5,627 | $67,335 |
| 2022 | $4,444 | $69,205 | $5,338 | $63,867 |
| 2021 | $4,284 | $64,832 | $5,000 | $59,832 |
| 2020 | $2,729 | $44,023 | $4,770 | $39,253 |
| 2019 | $2,729 | $44,023 | $4,770 | $39,253 |
| 2018 | $2,471 | $42,899 | $4,648 | $38,251 |
| 2017 | $2,418 | $42,075 | $4,559 | $37,516 |
| 2016 | $2,560 | $41,344 | $4,480 | $36,864 |
| 2015 | $2,481 | $40,935 | $4,436 | $36,499 |
| 2014 | $2,410 | $40,935 | $4,436 | $36,499 |
| 2013 | $2,451 | $40,935 | $4,436 | $36,499 |
Source: Public Records
Map
Nearby Homes
- 402 Rolling Green Dr
- Lot 1 Fletcher Ln
- Lot 2 Fletcher Ln
- Lot 3 Fletcher Ln
- 6680 John Dr
- Lot 32 Janine Way
- 400 Maddox Dr
- 820 Kirk Dr
- Lot 27 Tara Way
- Lot 20 Jeffrey Dr
- Lot 31 Woodbine Park Prairie Estates
- 125 W Walnut St
- 1440 N Alexander Dr
- 355 S Henderson St
- 570 Fawn Ct
- 4140 Fort Daniel Rd
- 8302 Goodwin Cir
- 8299 Goodwin Cir
- 265 Carrington Ave
- 925 S Wildwood Dr
- 6332 Venetian Way
- 6312 Venetian Way Dr
- 6312 Venetian Way
- 6339 Venetian Way Dr
- 6355 Venetian Way Dr
- 5436 N Kruse Rd
- 6371 Venetian Way Dr
- 5298 N Kruse Rd
- 5395 N Kruse Rd
- 5329 N Kruse Rd
- 5292 N Kruse Rd
- 5522 Gateway Dr
- 5452 N Kruse Rd
- 5530 Gateway Dr
- 5544 Gateway Dr
- 5544 Gateway Dr
- 5294 N Kruse Rd
- 6398 Venetian Way Dr
- 6398 Venetian Way
- 5491 N Kruse Rd