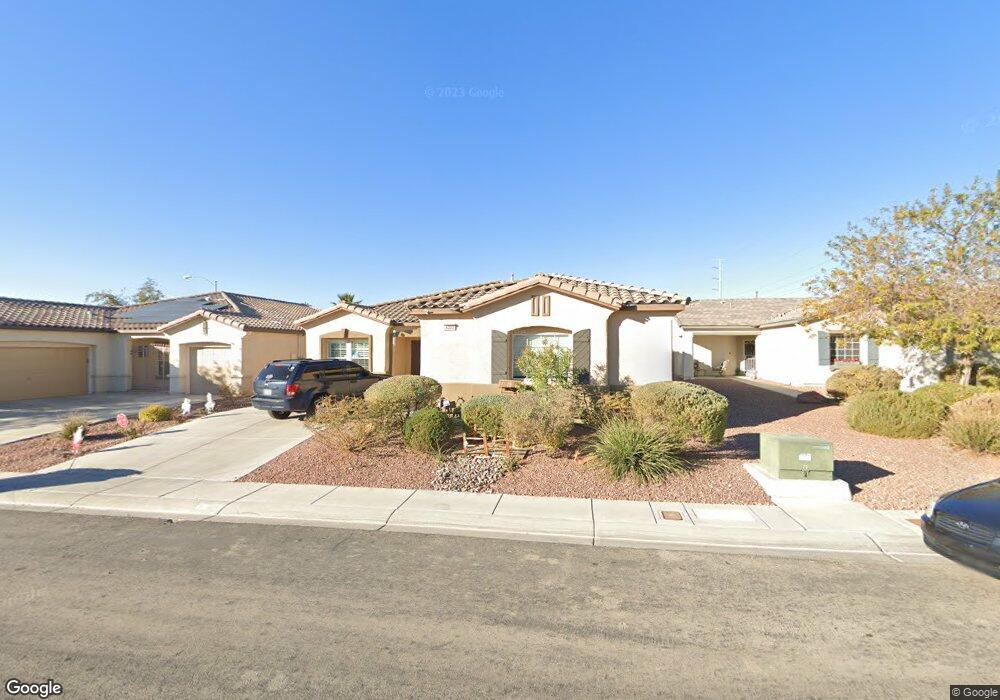
6333 Rangeland Ct North Las Vegas, NV 89081
Northridge NeighborhoodEstimated Value: $486,000 - $506,915
5
Beds
3
Baths
2,424
Sq Ft
$206/Sq Ft
Est. Value
About This Home
This home is located at 6333 Rangeland Ct, North Las Vegas, NV 89081 and is currently estimated at $498,729, approximately $205 per square foot. 6333 Rangeland Ct is a home located in Clark County with nearby schools including Don E. Hayden Elementary School, Ruby Duncan Elementary School, and Carroll M. Johnston STEM Academy of Environmental Studies.
Ownership History
Date
Name
Owned For
Owner Type
Purchase Details
Closed on
Dec 1, 2014
Sold by
Ney Daniel S and Ney Margaret C
Bought by
Carter Byron
Current Estimated Value
Home Financials for this Owner
Home Financials are based on the most recent Mortgage that was taken out on this home.
Original Mortgage
$267,776
Outstanding Balance
$150,018
Interest Rate
3.95%
Mortgage Type
VA
Estimated Equity
$348,711
Purchase Details
Closed on
Nov 23, 2011
Sold by
Montesa Llc
Bought by
Ney Daniel S and Ney Margaret C
Purchase Details
Closed on
Oct 13, 2011
Sold by
Varner Daniel G and Varner Adrienne B
Bought by
Montesa Llc
Purchase Details
Closed on
Aug 17, 2004
Sold by
William Lyon Homes Inc
Bought by
Varner Daniel G and Varner Adrienne B
Home Financials for this Owner
Home Financials are based on the most recent Mortgage that was taken out on this home.
Original Mortgage
$235,250
Interest Rate
5.97%
Mortgage Type
Unknown
Create a Home Valuation Report for This Property
The Home Valuation Report is an in-depth analysis detailing your home's value as well as a comparison with similar homes in the area
Home Values in the Area
Average Home Value in this Area
Purchase History
| Date | Buyer | Sale Price | Title Company |
|---|---|---|---|
| Carter Byron | $261,500 | Chicago Title Las Vegas | |
| Ney Daniel S | $169,000 | National Title Company | |
| Montesa Llc | $121,000 | National Title Company | |
| Varner Daniel G | $294,104 | Fidelity National Title |
Source: Public Records
Mortgage History
| Date | Status | Borrower | Loan Amount |
|---|---|---|---|
| Open | Carter Byron | $267,776 | |
| Previous Owner | Varner Daniel G | $235,250 | |
| Closed | Varner Daniel G | $58,800 |
Source: Public Records
Tax History Compared to Growth
Tax History
| Year | Tax Paid | Tax Assessment Tax Assessment Total Assessment is a certain percentage of the fair market value that is determined by local assessors to be the total taxable value of land and additions on the property. | Land | Improvement |
|---|---|---|---|---|
| 2025 | $1,529 | $158,537 | $35,700 | $122,837 |
| 2024 | $1,804 | $158,537 | $35,700 | $122,837 |
| 2023 | $1,804 | $147,579 | $31,850 | $115,729 |
| 2022 | $2,242 | $134,114 | $28,350 | $105,764 |
| 2021 | $2,176 | $125,120 | $24,500 | $100,620 |
| 2020 | $2,110 | $116,035 | $25,550 | $90,485 |
| 2019 | $2,084 | $109,994 | $22,050 | $87,944 |
| 2018 | $1,989 | $98,395 | $17,500 | $80,895 |
| 2017 | $2,963 | $88,332 | $16,800 | $71,532 |
| 2016 | $1,862 | $76,984 | $13,650 | $63,334 |
| 2015 | $1,858 | $64,972 | $9,450 | $55,522 |
| 2014 | $1,800 | $52,073 | $7,350 | $44,723 |
Source: Public Records
Map
Nearby Homes
- 6338 Black Mane Way
- 1409 Palomino Farm Way
- 6243 Black Mane Way
- 1713 Palomino Farm Way
- 1805 Palomino Farm Way Unit 3
- 1231 Appaloosa Hills Ave
- 6424 Amanda Michelle Ln
- 6242 Standing Elm St
- 1156 Appaloosa Hills Ave
- 6512 N Bruce St
- 6504 N Austin Moore St
- 6216 Sterling Ranch Way
- 1213 Bistro Bay Ave Unit 3
- 2014 Millergrove Ave
- 1023 Sunny Acres Ave
- 1008 Oceanwood Ave
- 1804 Jake Andrew Ave
- 6535 Summershade St
- 6519 Summershade St
- 2255 Woodbluff Ave
- 6337 Rangeland Ct Unit 4
- 6329 Rangeland Ct
- 6341 Rangeland Ct
- 6334 Black Mane Way
- 6330 Black Mane Way
- 6342 Black Mane Way Unit 1
- 6334 Rangeland Ct
- 6338 Rangeland Ct
- 1505 White Daisy Way
- 1509 White Daisy Way
- 1417 White Daisy Way
- 6342 Rangeland Ct
- 1513 White Daisy Way
- 1413 White Daisy Way
- 1517 White Daisy Way
- 1409 White Daisy Way
- 1605 White Daisy Way Unit 4
- 6337 Mill Ranch Ct
- 6333 Mill Ranch Ct Unit 4
- 6341 Mill Ranch Ct