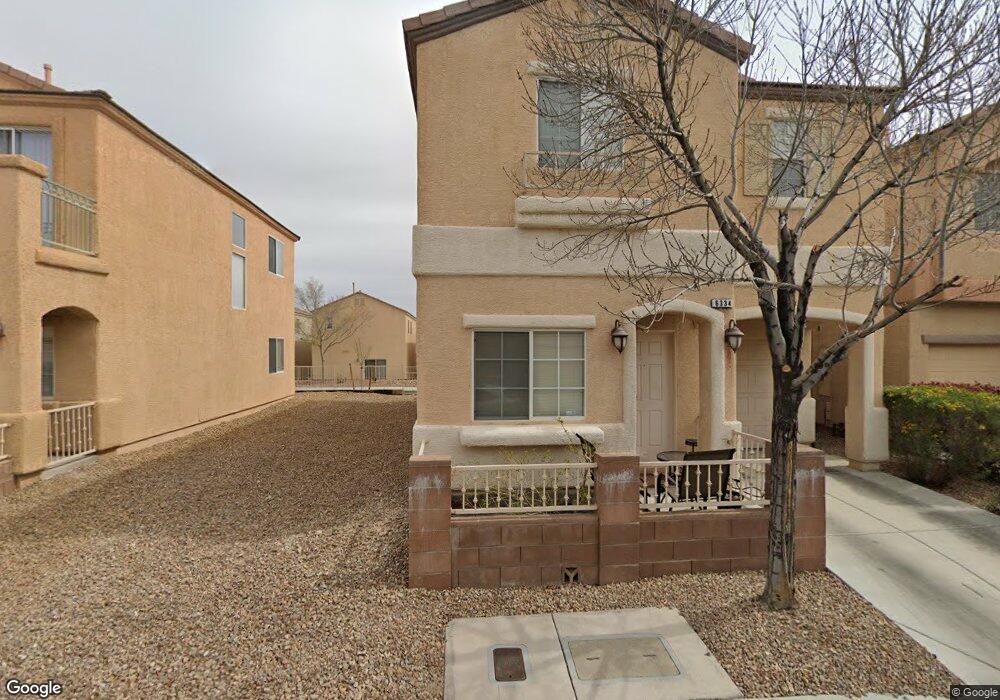
6334 Currant Lake Way Las Vegas, NV 89148
Estimated Value: $362,000 - $394,179
4
Beds
3
Baths
1,623
Sq Ft
$230/Sq Ft
Est. Value
About This Home
This home is located at 6334 Currant Lake Way, Las Vegas, NV 89148 and is currently estimated at $373,545, approximately $230 per square foot. 6334 Currant Lake Way is a home located in Clark County with nearby schools including Shelley Berkley Elementary School, Wilbur & Theresa Faiss Middle School, and Sierra Vista High School.
Ownership History
Date
Name
Owned For
Owner Type
Purchase Details
Closed on
Dec 16, 2008
Sold by
Us Bank National Association
Bought by
Givens Lorraine L
Current Estimated Value
Home Financials for this Owner
Home Financials are based on the most recent Mortgage that was taken out on this home.
Original Mortgage
$123,371
Outstanding Balance
$78,926
Interest Rate
5.49%
Mortgage Type
FHA
Estimated Equity
$294,619
Purchase Details
Closed on
Oct 28, 2008
Sold by
Sioson Corazon
Bought by
Us Bank National Association and Ramp 2005Efc1
Home Financials for this Owner
Home Financials are based on the most recent Mortgage that was taken out on this home.
Original Mortgage
$123,371
Outstanding Balance
$78,926
Interest Rate
5.49%
Mortgage Type
FHA
Estimated Equity
$294,619
Purchase Details
Closed on
Feb 23, 2005
Sold by
Richmond American Homes Of Nevada Inc
Bought by
Sioson Corazon
Home Financials for this Owner
Home Financials are based on the most recent Mortgage that was taken out on this home.
Original Mortgage
$207,990
Interest Rate
6.55%
Mortgage Type
Unknown
Create a Home Valuation Report for This Property
The Home Valuation Report is an in-depth analysis detailing your home's value as well as a comparison with similar homes in the area
Home Values in the Area
Average Home Value in this Area
Purchase History
| Date | Buyer | Sale Price | Title Company |
|---|---|---|---|
| Givens Lorraine L | $125,000 | Fidelity Rainbow | |
| Us Bank National Association | $75,251 | Fidelity National | |
| Sioson Corazon | $259,990 | Stewart Title Of Nevada |
Source: Public Records
Mortgage History
| Date | Status | Borrower | Loan Amount |
|---|---|---|---|
| Open | Givens Lorraine L | $123,371 | |
| Previous Owner | Sioson Corazon | $207,990 | |
| Closed | Sioson Corazon | $52,000 |
Source: Public Records
Tax History Compared to Growth
Tax History
| Year | Tax Paid | Tax Assessment Tax Assessment Total Assessment is a certain percentage of the fair market value that is determined by local assessors to be the total taxable value of land and additions on the property. | Land | Improvement |
|---|---|---|---|---|
| 2025 | $1,374 | $102,538 | $33,250 | $69,288 |
| 2024 | $1,335 | $102,538 | $33,250 | $69,288 |
| 2023 | $1,335 | $93,507 | $28,000 | $65,507 |
| 2022 | $1,296 | $81,452 | $21,700 | $59,752 |
| 2021 | $1,258 | $77,768 | $21,000 | $56,768 |
| 2020 | $1,219 | $76,505 | $20,300 | $56,205 |
| 2019 | $1,183 | $73,026 | $17,850 | $55,176 |
| 2018 | $1,162 | $66,812 | $14,000 | $52,812 |
| 2017 | $1,859 | $63,385 | $12,600 | $50,785 |
| 2016 | $1,089 | $56,459 | $9,800 | $46,659 |
| 2015 | $1,086 | $51,899 | $8,050 | $43,849 |
| 2014 | $1,052 | $34,799 | $4,550 | $30,249 |
Source: Public Records
Map
Nearby Homes
- 6321 Yampa River Way
- 9936 Elkhead Creek Way
- 9832 Corliss Ct
- 9841 Lake Austin Ct
- 9858 Sunriver Meadows Ave
- 10056 Cranbrook Falls Ct
- 6449 Lake Scene St
- 10093 Golden Bluff Ave
- 9709 Hawk Cliff Ave
- 9899 Vista Meadows Ave
- 6186 Old Rose Dr Unit 1
- 6228 Windfresh Dr Unit 2
- 6474 Aether St
- 6125 Powdermill St
- 9928 Regency Square Ave
- 9690 Valmeyer Ave
- 9988 Regency Square Ave
- 9826 Nicova Ave
- 9609 Rolling Thunder Ave
- 6294 Redstone Hills Dr
- 6338 Currant Lake Way
- 6330 Yampa River Way
- 6342 Currant Lake Way
- 6326 Yampa River Way Unit n/a
- 6326 Yampa River Way
- 6337 Currant Lake Way
- 6333 Currant Lake Way
- 6346 Currant Lake Way
- 6341 Currant Lake Way
- 6329 Yampa River Way
- 6345 Currant Lake Way
- 6335 Cheval Lake Way
- 6339 Cheval Lake Way
- 6331 Cheval Lake Way
- 6325 Yampa River Way Unit n/a
- 6325 Yampa River Way
- 6350 Currant Lake Way
- 6350 Currant Lake Way Unit n/a
- 9903 Elkhead Creek Way
- 6323 Cheval Lake Way