6334 Hedges Rd Ardmore, OK 73401
Estimated Value: $285,000 - $608,000
3
Beds
2
Baths
1,934
Sq Ft
$214/Sq Ft
Est. Value
About This Home
This home is located at 6334 Hedges Rd, Ardmore, OK 73401 and is currently estimated at $413,295, approximately $213 per square foot. 6334 Hedges Rd is a home located in Carter County with nearby schools including Plainview Primary School, Plainview Intermediate School, and Plainview Middle School.
Ownership History
Date
Name
Owned For
Owner Type
Purchase Details
Closed on
Jun 13, 2024
Sold by
Black Alma V
Bought by
Alma V Black Revocable Trust and Black
Current Estimated Value
Purchase Details
Closed on
May 22, 2006
Sold by
Craighead T C
Bought by
Claxton Shannon Lee and Claxton Jennifer Doty
Home Financials for this Owner
Home Financials are based on the most recent Mortgage that was taken out on this home.
Original Mortgage
$143,000
Interest Rate
9.65%
Mortgage Type
Adjustable Rate Mortgage/ARM
Purchase Details
Closed on
Mar 14, 1995
Sold by
Craighead, T C Trustee
Bought by
Claxton Shannon and Claxton Jenn
Purchase Details
Closed on
Mar 6, 1995
Sold by
Craighead, T C Trustee
Bought by
Claxton Shannon and Claxton Jenn
Create a Home Valuation Report for This Property
The Home Valuation Report is an in-depth analysis detailing your home's value as well as a comparison with similar homes in the area
Home Values in the Area
Average Home Value in this Area
Purchase History
| Date | Buyer | Sale Price | Title Company |
|---|---|---|---|
| Alma V Black Revocable Trust | -- | None Listed On Document | |
| Claxton Shannon Lee | -- | -- | |
| Claxton Shannon | -- | -- | |
| Claxton Shannon | $13,500 | -- |
Source: Public Records
Mortgage History
| Date | Status | Borrower | Loan Amount |
|---|---|---|---|
| Previous Owner | Claxton Shannon Lee | $143,000 |
Source: Public Records
Tax History Compared to Growth
Tax History
| Year | Tax Paid | Tax Assessment Tax Assessment Total Assessment is a certain percentage of the fair market value that is determined by local assessors to be the total taxable value of land and additions on the property. | Land | Improvement |
|---|---|---|---|---|
| 2025 | $2,138 | $24,353 | $4,535 | $19,818 |
| 2024 | $2,138 | $23,644 | $4,403 | $19,241 |
| 2023 | $2,071 | $22,956 | $4,314 | $18,642 |
| 2022 | $1,922 | $22,287 | $4,185 | $18,102 |
| 2021 | $1,919 | $21,638 | $3,954 | $17,684 |
| 2020 | $1,940 | $21,638 | $3,954 | $17,684 |
| 2019 | $1,837 | $21,071 | $3,954 | $17,117 |
| 2018 | $1,794 | $20,770 | $3,822 | $16,948 |
| 2017 | $1,749 | $20,165 | $3,616 | $16,549 |
| 2016 | $1,693 | $19,578 | $3,474 | $16,104 |
| 2015 | $1,673 | $19,007 | $1,977 | $17,030 |
| 2014 | $1,606 | $18,453 | $1,977 | $16,476 |
Source: Public Records
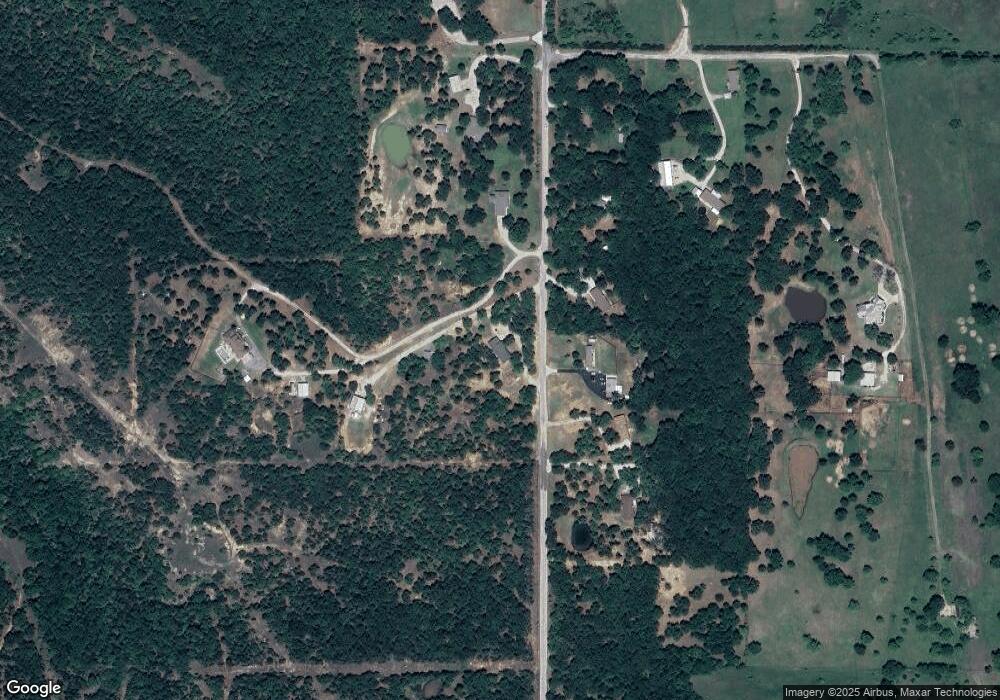
Map
Nearby Homes
- 103 Lockwood Ln
- 1777 Bussel Rd & Hedges Rd
- 2857 Bussell Ridge Rd
- 820 Cisco
- 002 Cisco Rd
- 3 Scott Rd
- 4 Scott Rd
- 400 Scenic Cir
- 284 Songbird Trail
- 0 State Highway 77
- 150 Chateau Bend
- 291 Golden Dr
- 579 Chateau Bend
- 37 Peddy St
- 780 Rickets Ln
- 39 Tuscan Rd
- 3125 S Commerce St
- 11868 Campbell Rd
- 11872 Campbell Rd
- 11870 Campbell Rd
- 6297 Hedges Rd
- 6391 Hedges Rd
- 6286 Hedges Rd
- 6417 Hedges Rd
- 6190 Hedges Rd
- 6195 Hedges Rd
- 6294 Hedges Rd
- 0 Hedges Rd Unit 34042
- .62 Hedges Rd
- 0 Hedges Rd Unit 27708
- 0 Hedges Rd Unit 2318083
- 0 Hedges Rd Unit 2312267
- 0 Hedges Rd Unit 2210695
- 0 Hedges Rd Unit 2039739
- 0 Hedges Rd Unit 2039725
- 0 Hedges Rd Unit 36426
- 0 Hedges Rd Unit 35372
- 5976 Hedges Rd
- 165 Paint Horse Rd
- 5880 Hedges Rd