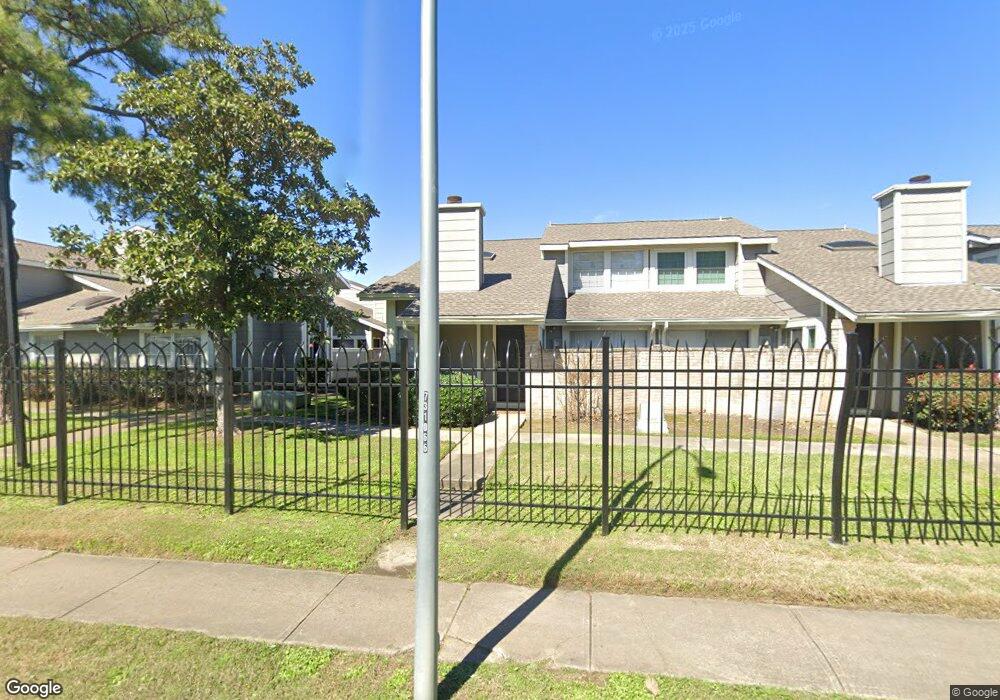
6334 W Airport Blvd Unit 633 Houston, TX 77035
Brays Oaks NeighborhoodEstimated Value: $117,000 - $213,000
3
Beds
2
Baths
1,196
Sq Ft
$123/Sq Ft
Est. Value
About This Home
This home is located at 6334 W Airport Blvd Unit 633, Houston, TX 77035 and is currently estimated at $147,013, approximately $122 per square foot. 6334 W Airport Blvd Unit 633 is a home located in Harris County with nearby schools including Anderson Elementary School, Fondren Middle School, and Westbury High School.
Ownership History
Date
Name
Owned For
Owner Type
Purchase Details
Closed on
Jan 31, 2021
Sold by
Rapini Luis and Brand Patricia
Bought by
Rapini & Brand Properties Llc
Current Estimated Value
Purchase Details
Closed on
Feb 7, 2015
Sold by
Ohiku Uwa and Ohiku Sophia U
Bought by
Rapini Luis and Brand Patricia
Purchase Details
Closed on
Sep 12, 2005
Sold by
Neal Ajibolade Carolyn and Ajibolade Ibikunle
Bought by
Ohiku Uwa
Home Financials for this Owner
Home Financials are based on the most recent Mortgage that was taken out on this home.
Original Mortgage
$26,950
Interest Rate
5.76%
Mortgage Type
Fannie Mae Freddie Mac
Purchase Details
Closed on
Oct 21, 2003
Sold by
Suggs Robert O and Suggs Bonnie
Bought by
Ajibolade Ibikunle and Neal Ajibolade Carolyn
Create a Home Valuation Report for This Property
The Home Valuation Report is an in-depth analysis detailing your home's value as well as a comparison with similar homes in the area
Home Values in the Area
Average Home Value in this Area
Purchase History
| Date | Buyer | Sale Price | Title Company |
|---|---|---|---|
| Rapini & Brand Properties Llc | -- | Concierge Title | |
| Rapini Luis | -- | American Title Co | |
| Ohiku Uwa | -- | -- | |
| Ajibolade Ibikunle | -- | First American Title |
Source: Public Records
Mortgage History
| Date | Status | Borrower | Loan Amount |
|---|---|---|---|
| Previous Owner | Ohiku Uwa | $26,950 |
Source: Public Records
Tax History Compared to Growth
Tax History
| Year | Tax Paid | Tax Assessment Tax Assessment Total Assessment is a certain percentage of the fair market value that is determined by local assessors to be the total taxable value of land and additions on the property. | Land | Improvement |
|---|---|---|---|---|
| 2025 | $2,380 | $129,408 | $31,986 | $97,422 |
| 2024 | $2,380 | $113,730 | $26,655 | $87,075 |
| 2023 | $2,380 | $109,528 | $21,324 | $88,204 |
| 2022 | $2,341 | $101,695 | $10,662 | $91,033 |
| 2021 | $1,833 | $78,658 | $10,662 | $67,996 |
| 2020 | $1,665 | $66,012 | $10,662 | $55,350 |
| 2019 | $1,642 | $62,409 | $5,064 | $57,345 |
| 2018 | $1,273 | $50,318 | $5,064 | $45,254 |
| 2017 | $1,323 | $50,318 | $5,064 | $45,254 |
| 2016 | $1,117 | $42,510 | $5,064 | $37,446 |
| 2015 | $790 | $42,510 | $5,064 | $37,446 |
| 2014 | $790 | $30,718 | $5,064 | $25,654 |
Source: Public Records
Map
Nearby Homes
- 12227 Sandpiper Dr Unit 122
- 12225 Sandpiper Dr Unit 122
- 12235 Lemon Ridge Ln Unit 122
- 6324 Shadow Tree Dr Unit 632
- 12123 Lemon Ridge Ln Unit 121
- 12111 Lemon Ridge Ln Unit 121
- 12232 Bob White Dr Unit 122
- 6317 Peacock Hills Dr
- 12380 Sandpiper Dr Unit 810
- 12380 Sandpiper Dr Unit 405
- 6383 Dryad Dr Unit 638
- 6305 Dryad Dr Unit 630
- 6202 W Airport Blvd
- 12102 Bob White Dr Unit 121
- 6172 W Airport Blvd
- 6633 W Airport Blvd Unit 704
- 6633 W Airport Blvd Unit 1111
- 6633 W Airport Blvd Unit 1106
- 6633 W Airport Blvd Unit 514
- 6633 W Airport Blvd Unit 1208
- 6332 W Airport Blvd Unit 633
- 6346 W Airport Blvd Unit 634
- 6344 W Airport Blvd Unit 634
- 6330 W Airport Blvd Unit 633
- 6342 W Airport Blvd Unit 634
- 6342 W Airport Blvd Unit 6342
- 12255 Sandpiper Dr Unit 122
- 12253 Sandpiper Dr Unit 122
- 6340 W Airport Blvd Unit 634
- 12251 Sandpiper Dr Unit 122
- 6338 W Airport Blvd Unit 633
- 6326 W Airport Blvd Unit 632
- 6326 W Airport Blvd
- 12249 Sandpiper Dr Unit 122
- 12247 Sandpiper Dr Unit 122
- 12247 Sandpiper Dr Unit 47
- 6336 W Airport Blvd Unit 633
- 12245 Sandpiper Dr Unit 122
- 6345 Shadow Tree Dr
- 6343 Shadow Tree Dr