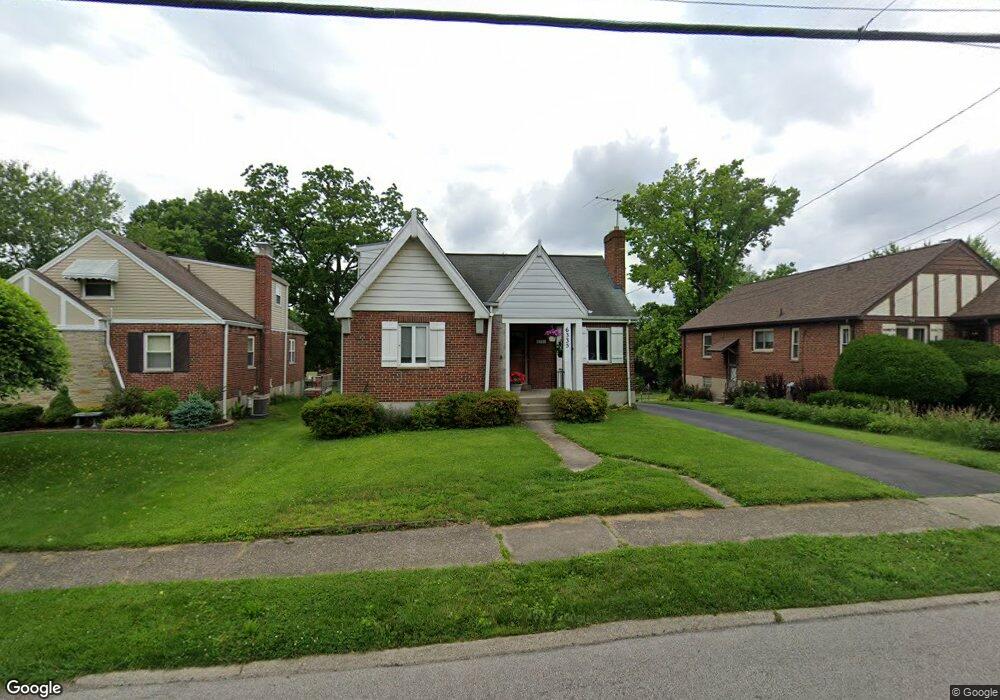
6335 Hammel Ave Cincinnati, OH 45237
Estimated Value: $237,000 - $280,000
4
Beds
2
Baths
2,108
Sq Ft
$120/Sq Ft
Est. Value
About This Home
This home is located at 6335 Hammel Ave, Cincinnati, OH 45237 and is currently estimated at $253,934, approximately $120 per square foot. 6335 Hammel Ave is a home located in Hamilton County with nearby schools including Pleasant Ridge Montessori School, Shroder High School, and Clark Montessori High School.
Ownership History
Date
Name
Owned For
Owner Type
Purchase Details
Closed on
Aug 23, 2002
Sold by
Nyswonger Robert S
Bought by
Nyswonger Robert S and Nyswonger Laura B
Current Estimated Value
Home Financials for this Owner
Home Financials are based on the most recent Mortgage that was taken out on this home.
Original Mortgage
$81,500
Outstanding Balance
$34,141
Interest Rate
6.41%
Estimated Equity
$219,793
Purchase Details
Closed on
Mar 14, 2001
Sold by
Nyswonger Gayle O
Bought by
Nyswonger Robert S
Purchase Details
Closed on
Aug 3, 2000
Sold by
Kahsar Frederick G and Nazarovech Michelle C
Bought by
Nyswonger Robert S
Home Financials for this Owner
Home Financials are based on the most recent Mortgage that was taken out on this home.
Original Mortgage
$80,800
Interest Rate
8.24%
Purchase Details
Closed on
Dec 28, 1998
Sold by
Kahsar Hattie L and Kahsar Hattie
Bought by
Kahsar Frederick G and Nazarovech Michelle C
Create a Home Valuation Report for This Property
The Home Valuation Report is an in-depth analysis detailing your home's value as well as a comparison with similar homes in the area
Home Values in the Area
Average Home Value in this Area
Purchase History
| Date | Buyer | Sale Price | Title Company |
|---|---|---|---|
| Nyswonger Robert S | -- | -- | |
| Nyswonger Robert S | -- | -- | |
| Nyswonger Robert S | $101,000 | -- | |
| Kahsar Frederick G | -- | -- |
Source: Public Records
Mortgage History
| Date | Status | Borrower | Loan Amount |
|---|---|---|---|
| Open | Nyswonger Robert S | $81,500 | |
| Closed | Nyswonger Robert S | $80,800 |
Source: Public Records
Tax History Compared to Growth
Tax History
| Year | Tax Paid | Tax Assessment Tax Assessment Total Assessment is a certain percentage of the fair market value that is determined by local assessors to be the total taxable value of land and additions on the property. | Land | Improvement |
|---|---|---|---|---|
| 2024 | $3,460 | $49,652 | $10,042 | $39,610 |
| 2023 | $3,531 | $49,652 | $10,042 | $39,610 |
| 2022 | $2,652 | $29,152 | $6,482 | $22,670 |
| 2021 | $2,569 | $29,152 | $6,482 | $22,670 |
| 2020 | $2,618 | $29,152 | $6,482 | $22,670 |
| 2019 | $2,622 | $25,799 | $5,737 | $20,062 |
| 2018 | $2,574 | $25,799 | $5,737 | $20,062 |
| 2017 | $2,502 | $25,799 | $5,737 | $20,062 |
| 2016 | $3,250 | $33,198 | $6,377 | $26,821 |
| 2015 | $3,026 | $33,198 | $6,377 | $26,821 |
| 2014 | $2,876 | $33,198 | $6,377 | $26,821 |
| 2013 | $2,904 | $33,198 | $6,377 | $26,821 |
Source: Public Records
Map
Nearby Homes
- 2425 Bremont Ave
- 6314 Hammel Ave
- 2424 Canterbury Ave
- 2421 Ardmore Ave
- 2526 Bremont Ave
- 6243 Graceland Ave
- 6322 Elbrook Ave
- 6235 Ridgeacres Dr
- 2524 Ardmore Ave
- 2604 Saint Albans Ave
- 2365 Vera Ave
- 6047 Yosemite Dr
- 6110 Graceland Ave
- 2537 Vera Ave
- 2539 Vera Ave
- 2541 Vera Ave
- 6230 Stover Ave
- 6119 Ridgeacres Dr
- 2543 Vera Ave
- 2652 Cedarbrook Dr
- 6331 Hammel Ave
- 6339 Hammel Ave
- 6327 Hammel Ave
- 6338 Graceland Ave
- 6401 Hammel Ave
- 6334 Graceland Ave
- 6323 Hammel Ave
- 6342 Graceland Ave
- 6407 Hammel Ave
- 6319 Hammel Ave
- 6334 Hammel Ave
- 6338 Hammel Ave
- 6330 Hammel Ave
- 6326 Graceland Ave
- 6402 Graceland Ave
- 6326 Hammel Ave
- 6411 Hammel Ave
- 6317 Hammel Ave
- 6406 Graceland Ave
- 6322 Graceland Ave