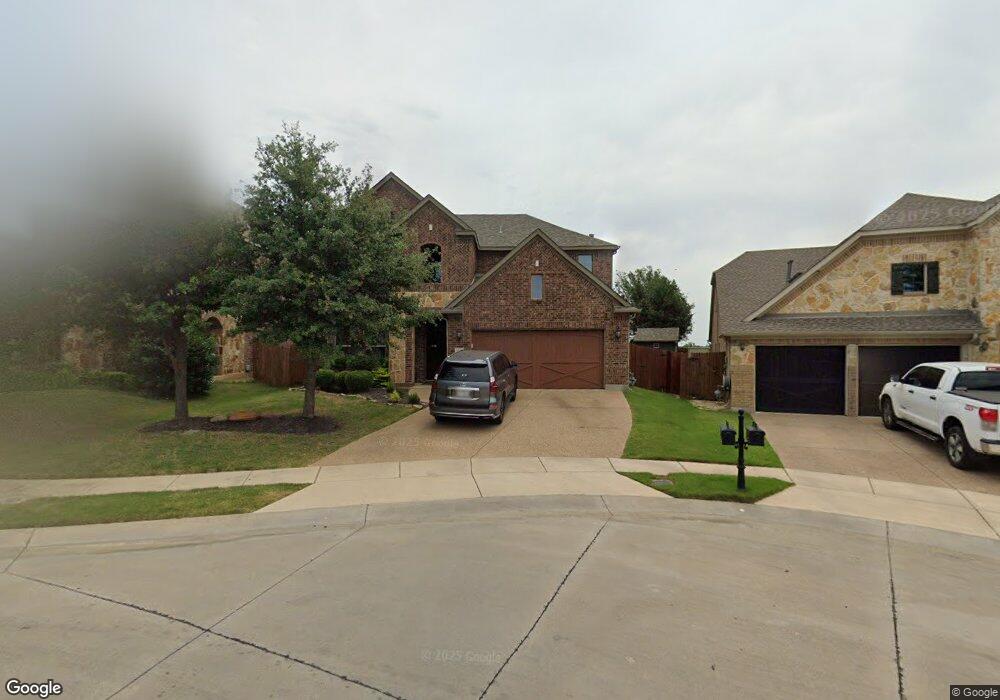
6336 Brynwyck Ln North Richland Hills, TX 76182
Estimated Value: $500,932 - $685,000
4
Beds
4
Baths
3,095
Sq Ft
$193/Sq Ft
Est. Value
About This Home
This home is located at 6336 Brynwyck Ln, North Richland Hills, TX 76182 and is currently estimated at $598,733, approximately $193 per square foot. 6336 Brynwyck Ln is a home located in Tarrant County with nearby schools including Walker Creek Elementary School, Smithfield Middle School, and Birdville High School.
Ownership History
Date
Name
Owned For
Owner Type
Purchase Details
Closed on
Nov 9, 2015
Sold by
Shannon Jerry L and Shannon Darcie M
Bought by
Sifuentes Patricia E
Current Estimated Value
Home Financials for this Owner
Home Financials are based on the most recent Mortgage that was taken out on this home.
Original Mortgage
$267,200
Outstanding Balance
$210,948
Interest Rate
3.9%
Mortgage Type
Purchase Money Mortgage
Estimated Equity
$387,785
Purchase Details
Closed on
Jun 10, 2013
Sold by
Meritage Homes Of Texas Llc
Bought by
Shannon Jerry L and Shannon Darcie M
Home Financials for this Owner
Home Financials are based on the most recent Mortgage that was taken out on this home.
Original Mortgage
$211,833
Interest Rate
3.38%
Mortgage Type
New Conventional
Create a Home Valuation Report for This Property
The Home Valuation Report is an in-depth analysis detailing your home's value as well as a comparison with similar homes in the area
Home Values in the Area
Average Home Value in this Area
Purchase History
| Date | Buyer | Sale Price | Title Company |
|---|---|---|---|
| Sifuentes Patricia E | -- | Lawyers Title | |
| Shannon Jerry L | -- | Carefree Title Agency Inc |
Source: Public Records
Mortgage History
| Date | Status | Borrower | Loan Amount |
|---|---|---|---|
| Open | Sifuentes Patricia E | $267,200 | |
| Previous Owner | Shannon Jerry L | $211,833 |
Source: Public Records
Tax History Compared to Growth
Tax History
| Year | Tax Paid | Tax Assessment Tax Assessment Total Assessment is a certain percentage of the fair market value that is determined by local assessors to be the total taxable value of land and additions on the property. | Land | Improvement |
|---|---|---|---|---|
| 2025 | $8,367 | $413,473 | $60,478 | $352,995 |
| 2024 | $8,367 | $479,000 | $60,478 | $418,522 |
| 2023 | $10,099 | $491,000 | $60,478 | $430,522 |
| 2022 | $10,071 | $448,259 | $60,478 | $387,781 |
| 2021 | $9,681 | $380,467 | $70,000 | $310,467 |
| 2020 | $9,273 | $364,432 | $70,000 | $294,432 |
| 2019 | $9,581 | $363,809 | $70,000 | $293,809 |
| 2018 | $8,419 | $345,000 | $70,000 | $275,000 |
| 2017 | $9,222 | $343,887 | $70,000 | $273,887 |
| 2016 | $8,384 | $311,611 | $40,000 | $271,611 |
| 2015 | $7,222 | $286,600 | $40,000 | $246,600 |
| 2014 | $7,222 | $286,600 | $40,000 | $246,600 |
Source: Public Records
Map
Nearby Homes
- 6432 Brynwyck Ln
- 8920 Martin Dr
- 6505 Parkway Ave
- 8886 Ice House Dr
- 8858 Mandalay St
- 8740 Ice House Dr
- 8748 Morris Mews
- 6509 Paula Ct
- 6137 Marquita Mews
- 8765 Bridge St
- 6521 Rock Springs Dr
- 6116 Morningside Dr
- 6008 Monterey Mews
- 6625 Crane Rd
- 6105 Parker Blvd
- 8412 Glenann Dr
- 8409 Main St
- 6124 Mayfair Mews
- 8908 Redding St
- 8409 Glenann Dr
- 6340 Brynwyck Ln
- 6344 Brynwyck Ln
- 6328 Brynwyck Ln
- 6348 Brynwyck Ln
- 6324 Brynwyck Ln
- 6341 Brynwyck Ln
- 8904 Michelle Ln
- 6345 Brynwyck Ln
- 6352 Brynwyck Ln
- 6320 Brynwyck Ln
- 6349 Brynwyck Ln
- 8913 Mid Cities Blvd
- 8908 Michelle Ln
- 6316 Brynwyck Ln
- 6356 Brynwyck Ln
- 6404 Brynwyck Ln
- 8901 Michelle Ln
- 6401 Brynwyck Ln
- 8909 Mid Cities Blvd
- 6408 Brynwyck Ln