6337 Maroon Mesa Dr Colorado Springs, CO 80918
Vista Grande NeighborhoodEstimated Value: $493,548 - $586,000
3
Beds
3
Baths
1,878
Sq Ft
$283/Sq Ft
Est. Value
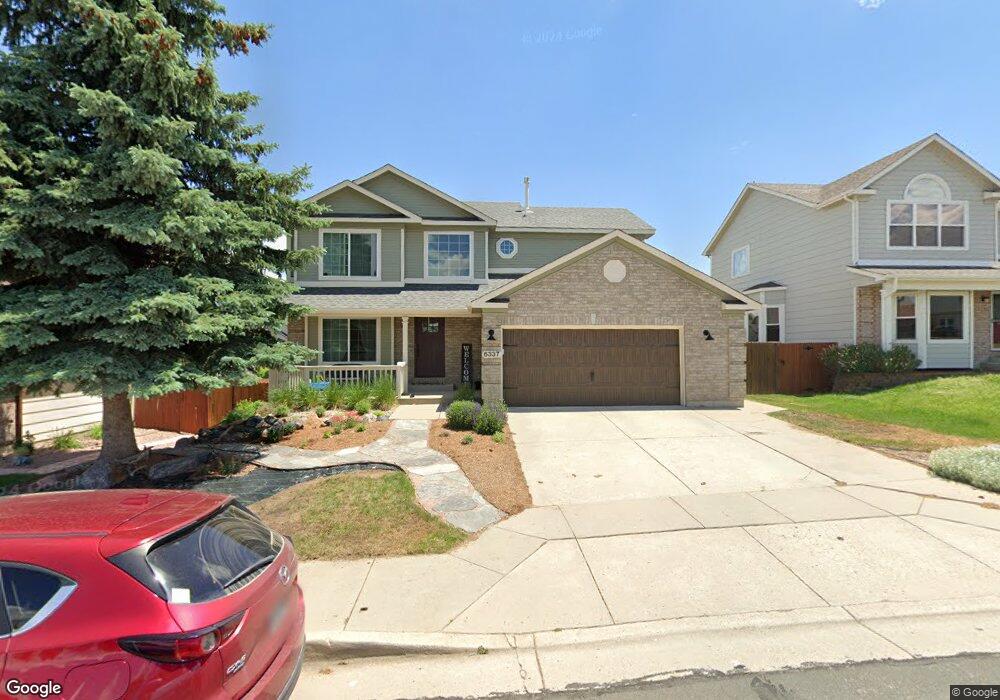
About This Home
This home is located at 6337 Maroon Mesa Dr, Colorado Springs, CO 80918 and is currently estimated at $531,887, approximately $283 per square foot. 6337 Maroon Mesa Dr is a home located in El Paso County with nearby schools including Martinez Elementary School, Jenkins Middle School, and Doherty High School.
Ownership History
Date
Name
Owned For
Owner Type
Purchase Details
Closed on
Dec 17, 2019
Sold by
Galley Austin D and Galley Brianna N
Bought by
Galley Austin D and Galley Brianna N
Current Estimated Value
Home Financials for this Owner
Home Financials are based on the most recent Mortgage that was taken out on this home.
Original Mortgage
$312,200
Outstanding Balance
$275,947
Interest Rate
3.73%
Mortgage Type
New Conventional
Estimated Equity
$255,940
Purchase Details
Closed on
Dec 7, 2017
Sold by
Moore Christopher D
Bought by
Galley Austin D and Knutson Brianna N
Home Financials for this Owner
Home Financials are based on the most recent Mortgage that was taken out on this home.
Original Mortgage
$319,675
Interest Rate
3.94%
Mortgage Type
New Conventional
Purchase Details
Closed on
Nov 21, 2014
Sold by
Vandiver Jon G and Vandiver Nancy J
Bought by
Moore Christopher D
Home Financials for this Owner
Home Financials are based on the most recent Mortgage that was taken out on this home.
Original Mortgage
$274,829
Interest Rate
3.5%
Mortgage Type
FHA
Purchase Details
Closed on
Jul 15, 2014
Sold by
Vitera John M and Vitera Jessica B
Bought by
Vandiver Jon G and Vandiver Nancy J
Home Financials for this Owner
Home Financials are based on the most recent Mortgage that was taken out on this home.
Original Mortgage
$135,000
Interest Rate
4.17%
Mortgage Type
New Conventional
Purchase Details
Closed on
Mar 7, 2011
Sold by
Wells Fargo Bank Na
Bought by
Vitera John M and Vitera Jessica B
Home Financials for this Owner
Home Financials are based on the most recent Mortgage that was taken out on this home.
Original Mortgage
$198,828
Interest Rate
4.75%
Mortgage Type
FHA
Purchase Details
Closed on
Nov 19, 2010
Sold by
Ross Carolyn M
Bought by
Wells Fargo Bank Na and Wachovia Mortgage Fsb
Purchase Details
Closed on
Oct 20, 2010
Sold by
Ross Carolyn M
Bought by
Wells Fargo Bank Na
Purchase Details
Closed on
Oct 18, 2001
Sold by
Donaldson Marilyn Joyce
Bought by
Ross Carolyn M
Home Financials for this Owner
Home Financials are based on the most recent Mortgage that was taken out on this home.
Original Mortgage
$202,500
Interest Rate
10.5%
Purchase Details
Closed on
Apr 18, 1995
Sold by
Elite Properties Of America Inc
Bought by
Donaldson Marilyn Joyce
Home Financials for this Owner
Home Financials are based on the most recent Mortgage that was taken out on this home.
Original Mortgage
$105,700
Interest Rate
8.53%
Purchase Details
Closed on
Oct 28, 1994
Sold by
Jbs Corp
Bought by
Elite Properties Of America Inc
Create a Home Valuation Report for This Property
The Home Valuation Report is an in-depth analysis detailing your home's value as well as a comparison with similar homes in the area
Home Values in the Area
Average Home Value in this Area
Purchase History
| Date | Buyer | Sale Price | Title Company |
|---|---|---|---|
| Galley Austin D | -- | Ascendant Title Co | |
| Galley Austin D | $336,500 | Unified Title Co | |
| Moore Christopher D | $279,900 | None Available | |
| Vandiver Jon G | $260,000 | Land Title Guarantee Company | |
| Vitera John M | $204,000 | Servicelink | |
| Wells Fargo Bank Na | -- | None Available | |
| Wells Fargo Bank Na | $228,980 | None Available | |
| Ross Carolyn M | $225,000 | North American Title Co | |
| Donaldson Marilyn Joyce | $155,315 | Land Title | |
| Elite Properties Of America Inc | $27,500 | Land Title |
Source: Public Records
Mortgage History
| Date | Status | Borrower | Loan Amount |
|---|---|---|---|
| Open | Galley Austin D | $312,200 | |
| Closed | Galley Austin D | $319,675 | |
| Previous Owner | Moore Christopher D | $274,829 | |
| Previous Owner | Vandiver Jon G | $135,000 | |
| Previous Owner | Vitera John M | $198,828 | |
| Previous Owner | Ross Carolyn M | $202,500 | |
| Previous Owner | Donaldson Marilyn Joyce | $105,700 | |
| Closed | Elite Properties Of America Inc | $0 |
Source: Public Records
Tax History Compared to Growth
Tax History
| Year | Tax Paid | Tax Assessment Tax Assessment Total Assessment is a certain percentage of the fair market value that is determined by local assessors to be the total taxable value of land and additions on the property. | Land | Improvement |
|---|---|---|---|---|
| 2025 | $1,789 | $35,500 | -- | -- |
| 2024 | $1,673 | $34,460 | $5,700 | $28,760 |
| 2023 | $1,673 | $34,460 | $5,700 | $28,760 |
| 2022 | $1,542 | $25,750 | $5,060 | $20,690 |
| 2021 | $1,667 | $26,490 | $5,210 | $21,280 |
| 2020 | $1,645 | $22,910 | $4,530 | $18,380 |
| 2019 | $1,637 | $22,910 | $4,530 | $18,380 |
| 2018 | $1,492 | $19,300 | $3,810 | $15,490 |
| 2017 | $1,417 | $19,300 | $3,810 | $15,490 |
| 2016 | $1,200 | $19,390 | $3,940 | $15,450 |
| 2015 | $1,196 | $19,390 | $3,940 | $15,450 |
| 2014 | $1,151 | $17,960 | $3,890 | $14,070 |
Source: Public Records
Map
Nearby Homes
- 5745 Doe Skin Ct
- 4265 Dolphin Cir
- 6103 Treeledge Dr
- 4431 Flat Top Place
- 4735 Seton Place
- 6463 Bluffmont Point
- 5739 Wells Fargo Dr E
- 6515 Medicine Springs Dr
- 4224 Mesa Overlook Point
- 4718 Rowland Heights
- 4543 Clark Fork Place
- 6256 Fowler Mill Point
- 6243 Fowler Mill Point
- 6030 Barnacle Ct
- 4217 High Timberline View
- 6662 Barrel Race Dr
- 4229 High Timberline View
- 5978 Maroon Mesa Dr
- 6315 Andersen Mill Heights Unit 206
- 4740 Rustler Ct
- 6329 Maroon Mesa Dr
- 6403 Maroon Mesa Dr
- 6321 Maroon Mesa Dr
- 6411 Maroon Mesa Dr
- 4299 Brushridge Dr
- 6410 Maroon Mesa Dr
- 6313 Maroon Mesa Dr
- 6419 Maroon Mesa Dr
- 4291 Brushridge Dr
- 6294 Soaring Dr
- 6418 Maroon Mesa Dr
- 4455 Seton Place
- 6305 Maroon Mesa Dr
- 4282 Brushridge Dr
- 6290 Soaring Dr
- 4283 Brushridge Dr
- 6427 Maroon Mesa Dr
- 4445 Seton Place
- 4465 Seton Place
- 6426 Maroon Mesa Dr